Browse our range of reports and publications including performance and financial statement audit reports, assurance review reports, information reports and annual reports.
Australian Government Procurement Contract Reporting

Please direct enquiries through our contact page.
Procurement is a significant public sector activity worth $47.4 billion in 2016–17. This information report seeks to provide greater transparency on procurement activity in the Australian public sector. This information report is neither an audit nor an assurance review and presents no conclusions or opinions. The report presents in a variety of ways, including tables and figures, publicly available data from public sector procurement activity.
Summary
1. The purpose of the Australian National Audit Office (ANAO) is to improve public sector performance and support accountability and transparency in the Australian Government sector through independent reporting to the Parliament, the Executive and the public.
2. Procurement is a significant public sector activity worth $47.4 billion in 2016–17.1 This information report seeks to provide greater transparency on procurement activity in the Australian public sector. This information report is neither an audit nor an assurance review. This means that no conclusions or opinions are presented. The report presents publicly available data from public sector procurement activity in a number of ways. The approach to analysis is set out in Appendix 1 which includes important background to the data and methodology used. The Auditor-General Act 1997 (section 25) enables the Auditor-General at any time to cause a report to be tabled in either House of the Parliament on any matter.
3. In conducting this work, the ANAO did not obtain information from individual entities in respect of the data reported on, nor did the ANAO formally communicate with the entities included in this report in respect of this analysis. However, the ANAO did release relevant parts of the report to the Department of Finance, the Department of Veterans’ Affairs and the Australian Bureau of Statistics for comment prior to publication.
4. The ANAO has not tested the integrity of the underlying data contained in this report and, accordingly, does not provide any assurance in respect of the reliability of that data. The analysis contained in this report is based on the reported contract notice data as of the date it was extracted. Contract notices may be amended or updated, which would impact on the analysis. In addition, contract notifications may not reflect actual expenditure in each instance.
5. The Commonwealth Procurement Rules (CPRs) issued by the Minister for Finance outline the Government’s procurement policy framework. Their core objective is to ensure relevant entities2 achieve value for money in the conduct of procurement activity.
6. The CPRs contain mandatory requirements to support this objective as well as providing tools and guidance to ensure accountability and transparency in Government contracts.
7. Procurements with an estimated monetary value above the relevant reporting thresholds3 must be publicly reported via the Australian Government’s procurement information system, AusTender. The objectives of AusTender are to provide timely and transparent information on Government procurement.
Report
1. Background
1.1 Procurement of goods and services is an important and substantial activity for Australian Commonwealth entities to achieve their objectives. The Department of Finance's most recent publication on 'Statistics on Australian Government Procurement Contracts' reported in that in 2016–17, 64 092 contract notices were published on AusTender with a total value of $47.4 billion.4
1.2 Each reporting entity is responsible for the accurate and timely reporting of contracts on AusTender.
1.3 Inaccurate contract reporting has been discussed in numerous ANAO audits.5 Most recently, the audit of Limited Tender Procurement found that only 41 of 155 contracts examined, correctly reported all details on AusTender.6 Common issues included inaccuracies in contract dates, contract values, procurement method, and categories of procurement.
1.4 This report covers a range of themes and analysis of the Australian Government's centralised publication of contract notices. The report aims to provide insight and information addressing the following areas:
- the volume and value of Government procurement contracts by entity, product/service categories, and other characteristics;
- entities' procurement contract behaviour in regards to the timing of procurements during each financial year, their use of procurement methods and confidentiality clauses, and amendments to contracts;
- accuracy and timeliness of entities' procurement contract reporting; and
- reporting on the number and value of procurement contracts undertaken with Small to Medium Enterprises (SMEs).
2. Procurement contracts by entity
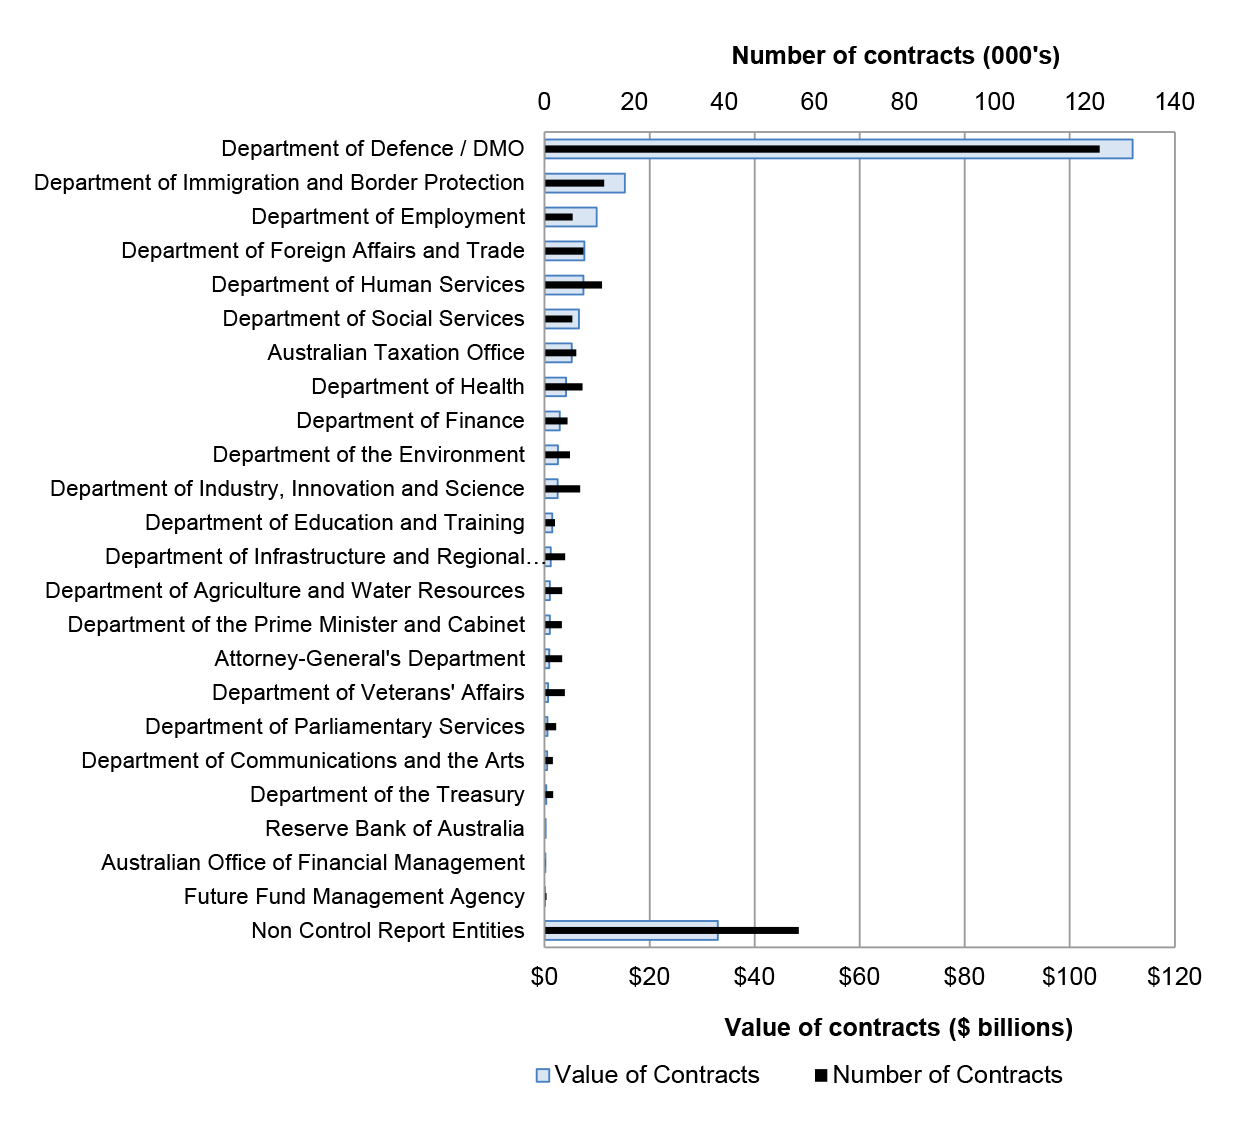
2.1 Figure 2.1 shows the total number and value of contracts with a listed start date in the period 2012–13 to 2016–17. The ANAO has aggregated contracts where entities have published multiple contract notices for purchases that relate to the same contract.7
Figure 2.1: Number of contracts and value of contracts by entity8 (2012–13 to 2016–17)
Source: ANAO analysis of AusTender data.
Table 2.1: Number of contracts and value of contracts by entity (2012–13 to 2016–17)9
|
Entity |
Number of contracts |
Contract value ($000's) |
|
Attorney-General's Department |
3,870 |
866,021 |
|
Australian Office of Financial Management |
161 |
145,197 |
|
Australian Taxation Office |
7,028 |
5,163,591 |
|
Department of Agriculture and Water Resources |
3,906 |
1,013,731 |
|
Department of Communications and the Arts |
1,849 |
463,406 |
|
Department of Defence / DMO |
123,319 |
111,963,583 |
|
Department of Education and Training |
2,279 |
1,466,787 |
|
Department of Employment |
6,250 |
9,905,288 |
|
Department of Finance |
5,105 |
2,905,746 |
|
Department of Foreign Affairs and Trade |
8,601 |
7,561,204 |
|
Department of Health |
8,418 |
4,093,154 |
|
Department of Human Services |
12,789 |
7,397,857 |
|
Department of Immigration and Border Protection |
13,198 |
15,266,862 |
|
Department of Industry, Innovation and Science |
7,917 |
2,481,862 |
|
Department of Infrastructure and Regional Development |
4,536 |
1,174,850 |
|
Department of Parliamentary Services |
2,581 |
536,042 |
|
Department of Social Services |
6,147 |
6,543,660 |
|
Department of the Environment |
5,658 |
2,553,943 |
|
Department of the Prime Minister and Cabinet |
3,853 |
976,467 |
|
Department of the Treasury |
1,926 |
332,467 |
|
Department of Veterans' Affairs |
4,520 |
674,600 |
|
Future Fund Management Agency |
432 |
83,647 |
|
Non Control Report Entities |
56,497 |
33,000,701 |
|
Reserve Bank of Australia |
27 |
224,079 |
|
Total |
290,867 |
216,794,744a |
Note a: Figures in table may not sum due to rounding.
Source: ANAO analysis of AusTender data.
3. Procurement contract categories (Products and Services)
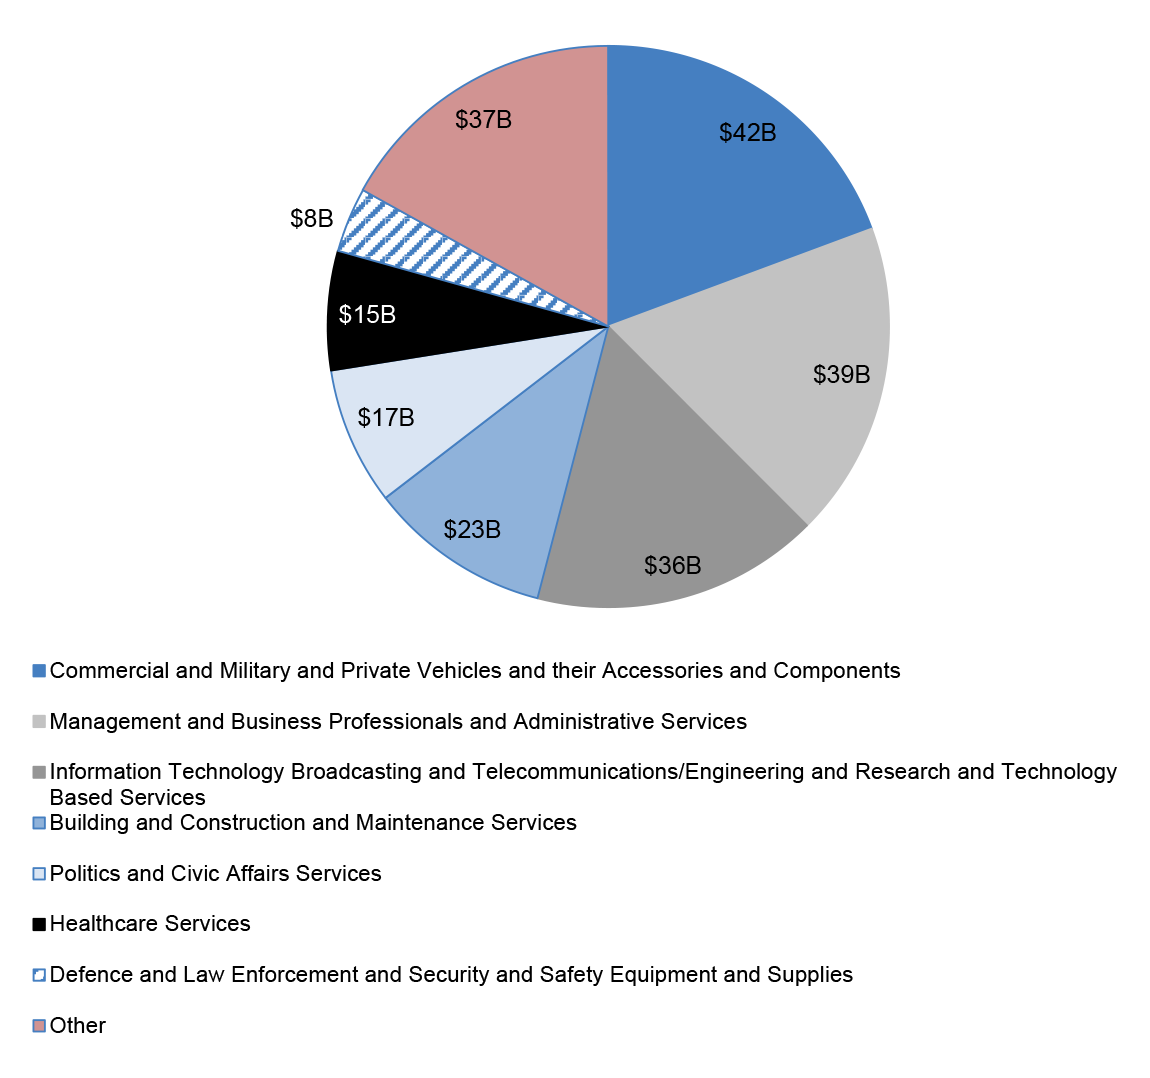
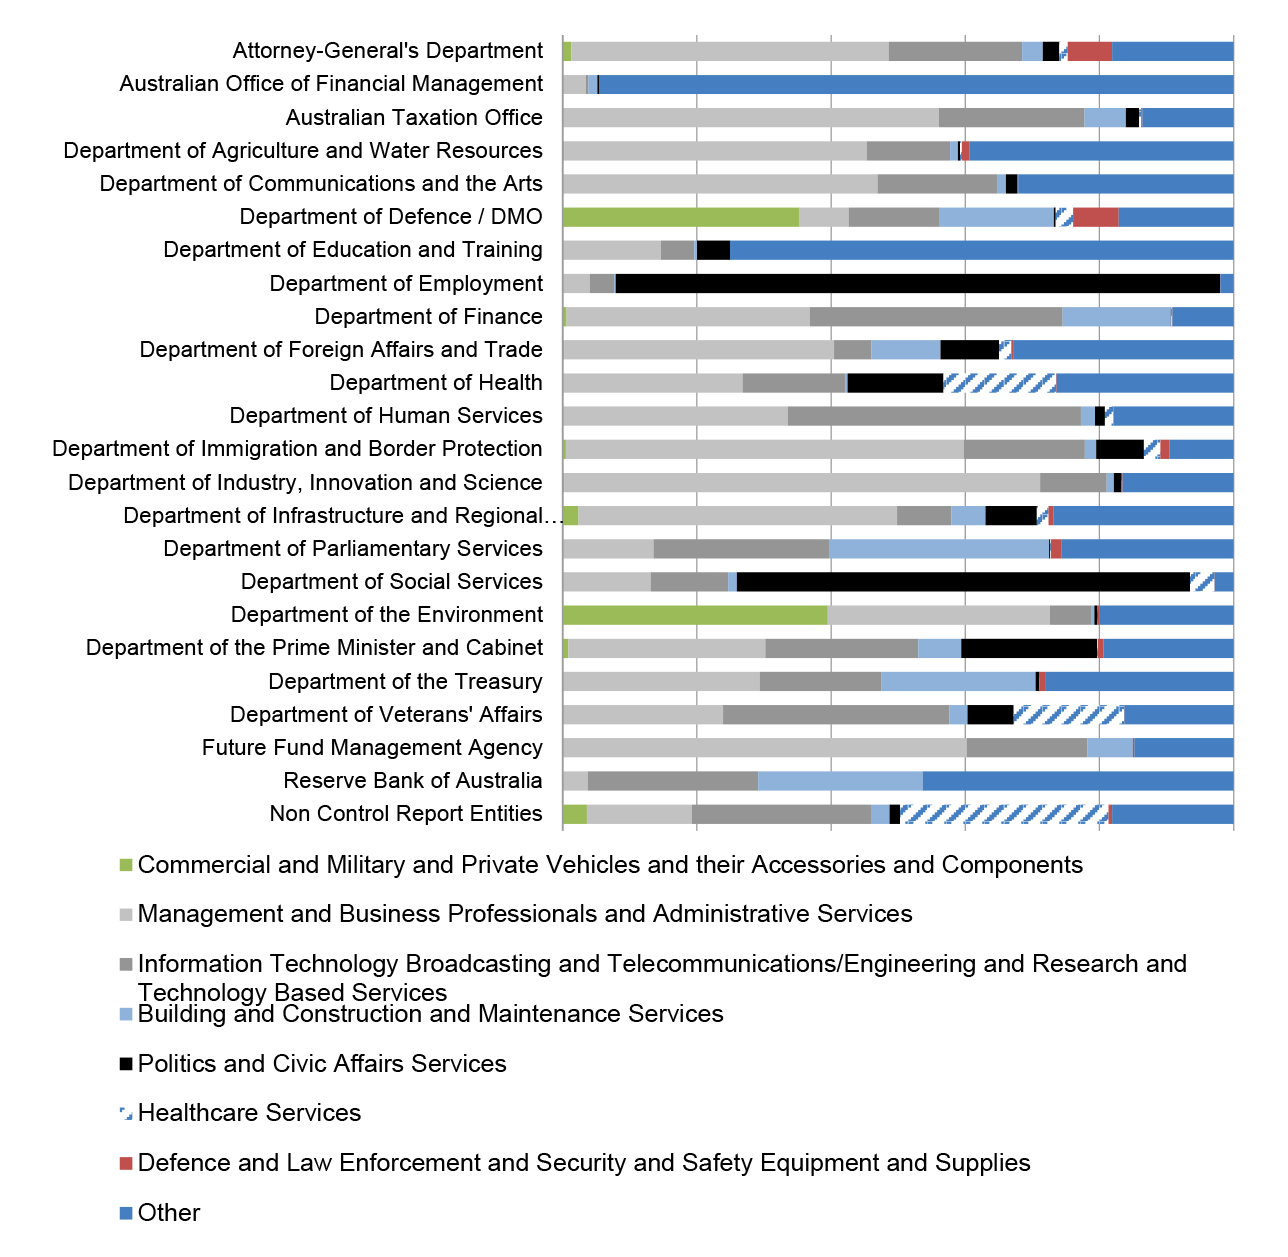
3.1 Figures and Tables below show the classification of contracts based on Department of Finance's customised United Nations Standard Products and Services Code.10
Figure 3.1: Contract values by product and services category (2012–13 to 2016–17)11 12
Source: ANAO analysis of AusTender data.
Figure 3.2: Proportion of contract value by entity (2012–2013 to 2016–17) 13 14 15
Source: ANAO analysis of AusTender data.
Table 3.1: Largest product and service categories of contract value by financial year (categories with five-year totals greater than $5 billion – 2012–13 to 2016–17) ($000's)16 17
|
Product and service category |
2012–13 |
2013–14 |
2014–15 |
2015–16 |
2016–17 |
Totala |
|
Commercial and Military and Private Vehicles and their Accessories and Components |
9,695,489 |
8,136,624 |
9,364,908 |
10,421,762 |
4,289,032 |
41,907,815 |
|
Management and Business Professionals and Administrative Services |
8,585,409 |
7,536,104 |
10,355,005 |
7,109,743 |
5,832,384 |
39,418,644 |
|
Information Technology Broadcasting and Telecommunications/Engineering and Research and Technology Based Servicesb |
9,977,054 |
5,667,364 |
7,360,962 |
7,175,849 |
5,707,465 |
35,888,695 |
|
Building and Construction and Maintenance Services |
2,684,062 |
2,288,719 |
9,578,568 |
3,963,237 |
4,233,700 |
22,748,285 |
|
Politics and Civic Affairs Services |
1,552,581 |
4,847,937 |
798,106 |
9,441,672 |
562,084 |
17,202,381 |
|
Healthcare Services |
3,459,557 |
243,929 |
1,552,659 |
325,369 |
9,255,727 |
14,837,241 |
|
Defence and Law Enforcement and Security and Safety Equipment and Supplies |
795,670 |
1,084,897 |
1,876,394 |
2,213,538 |
2,147,554 |
8,118,054 |
|
Otherc |
8,479,081 |
7,837,171 |
5,552,271 |
9,821,092 |
4,984,016 |
36,673,630 |
|
Totala |
45,228,905 |
37,642,745 |
46,438,872 |
50,472,261 |
37,011,961 |
216,794,744 |
Note a: Figures in table may not sum due to rounding.
Note b: ANAO has combined the categories of 'Information Technology Broadcasting and Telecommunications' and 'Engineering and Research and Technology Based Services'.
Note c: Other includes all other categories of contracts.
Source: ANAO analysis of AusTender data.
4. IT broadcasting, telecommunications, technology based services, engineering and research
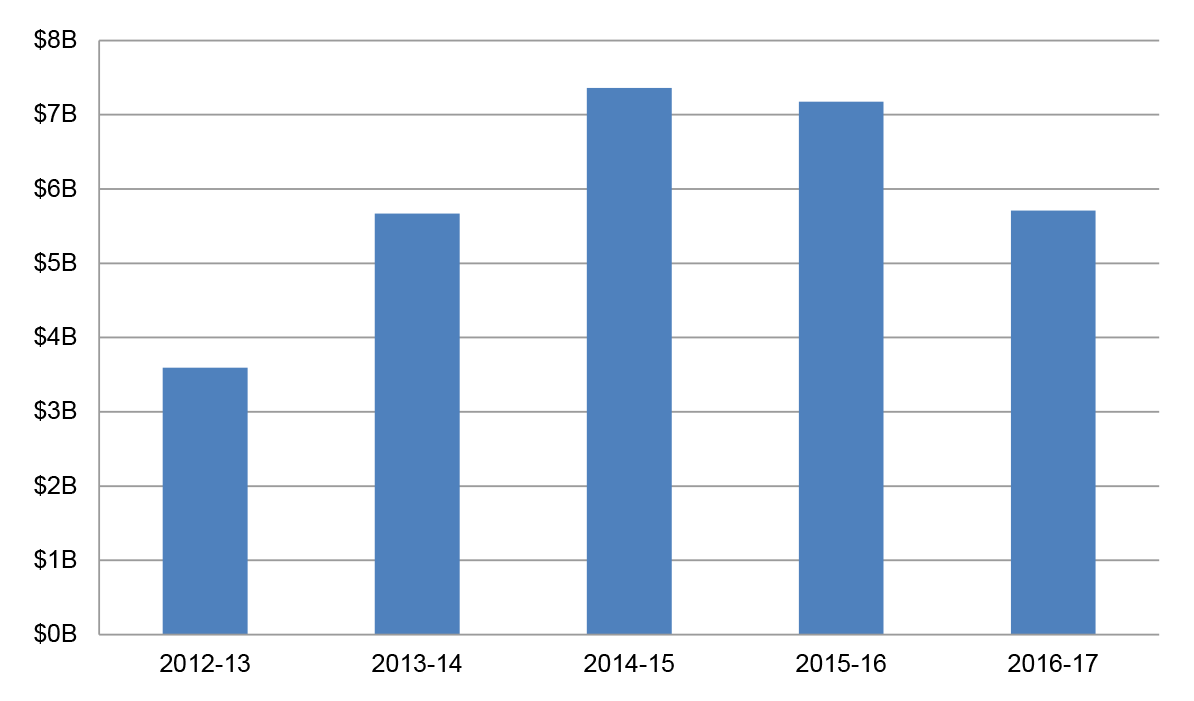
4.1 This chapter shows contracts that entities have classified as either 'IT Broadcasting, Telecommunications' or 'Engineering and Research and Technology Based Services' using Department of Finance's customised United Nations Standard Products and Services Code.18
Figure 4.1: IT, telecommunications, tech and engineering contract value by financial year (2012–13 to 2016–17)19 20
Source: ANAO analysis of AusTender data.
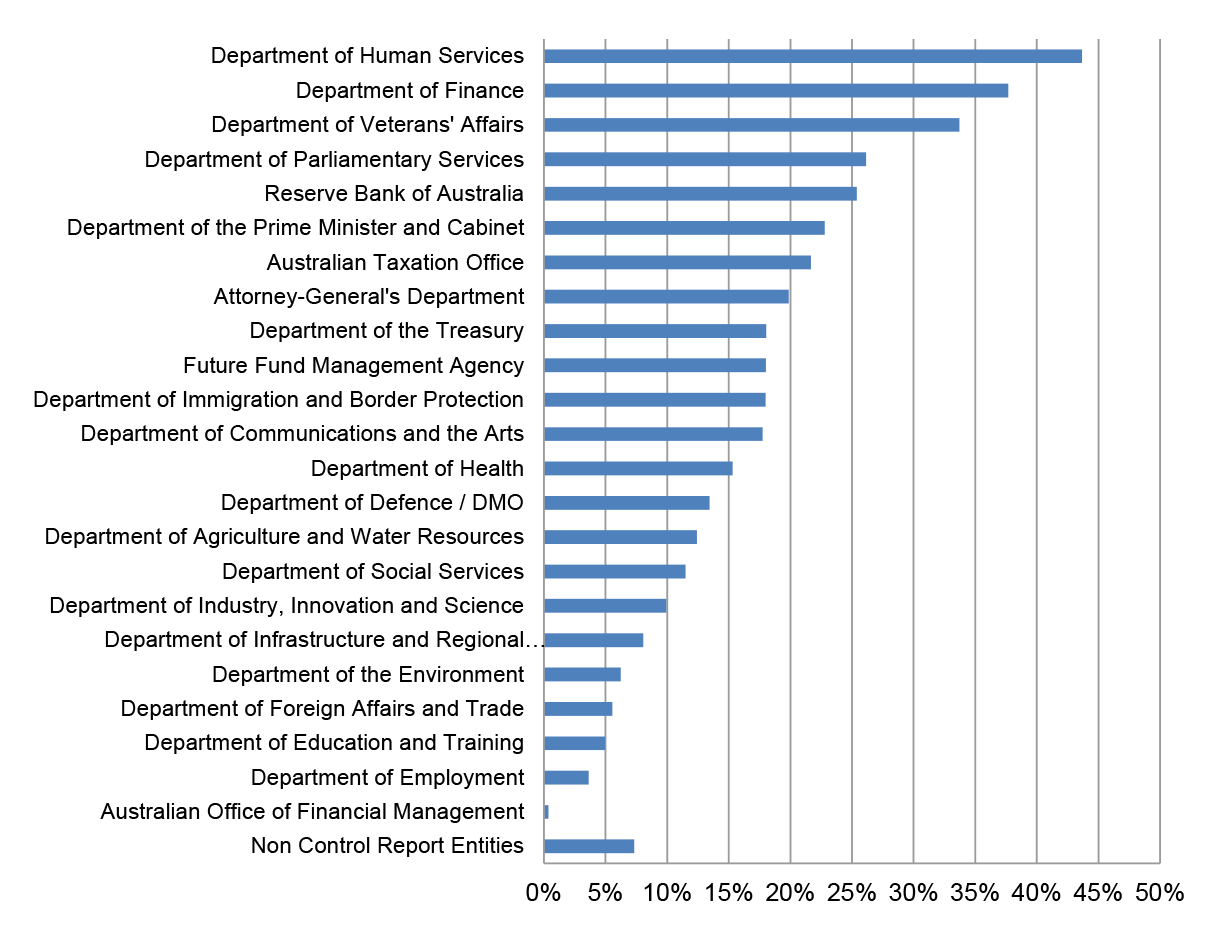
Figure 4.2: Contract value categorised as IT, broadcasting, telecommunications, or engineering and research and technology based services as a percentage of total entity contract value (2012–13 to 2016–17) 21 22
Source: ANAO analysis of AusTender data.
Table 4.1: IT, broadcasting, telecommunications, or engineering and research and technology based services contract value 2012–13 to 2016–1723
|
Entity |
Contract value ($000's) |
|
Department of Defence / DMO |
15,058,177 |
|
Department of Human Services |
3,230,632 |
|
Department of Immigration and Border Protection |
2,747,713 |
|
Australian Taxation Office |
1,119,242 |
|
Department of Finance |
1,094,791 |
|
Department of Social Services |
752,408 |
|
Department of Health |
626,414 |
|
Department of Foreign Affairs and Trade |
419,820 |
|
Department of Employment |
358,717 |
|
Department of Industry, Innovation and Science |
246,366 |
|
Department of Veterans' Affairs |
227,468 |
|
Department of the Prime Minister and Cabinet |
222,534 |
|
Attorney-General's Department |
172,022 |
|
Department of the Environment |
159,019 |
|
Department of Parliamentary Services |
140,166 |
|
Department of Agriculture and Water Resources |
125,763 |
|
Department of Infrastructure and Regional Development |
94,613 |
|
Department of Communications and the Arts |
82,270 |
|
Department of Education and Training |
72,902 |
|
Department of the Treasury |
60,005 |
|
Reserve Bank of Australia |
56,902 |
|
Future Fund Management Agency |
15,070 |
|
Australian Office of Financial Management |
520 |
|
Non Control Report Entities |
2,421,312 |
|
Total |
29,504,845a |
Note a: Figures in table may not sum due to rounding.
Source: ANAO analysis of AusTender data.
4.2 Table 4.2 identifies the largest suppliers by contract value categorised as IT, Broadcasting, Telecommunications, or Engineering and Research and Technology Based Services in the last five financial years (those with greater than $300 million in contract value). The total contract value with government for each supplier, regardless of the product/service category is also provided.
4.3 Contracts for suppliers listed below have been identified and aggregated using both the Australian Business Number listed on the AusTender contract notice and a keyword match of the Supplier Name field.24
Table 4.2: Largest IT, broadcasting, telecommunications, or engineering and research and technology based services suppliers to Government (2012–13 to 2016–17)25
|
Supplier |
Number of contracts (IT, broadcasting, telecommunications, or engineering and research and technology based services contracts) |
Value of contracts (IT, broadcasting, telecommunications, or engineering and research and technology based services contracts) ($000's) |
Value of contracts (All categories of contracts) ($000's) |
|
IBM |
692 |
2,142,256 |
2,325,307 |
|
Boeing |
165 |
1,601,297 |
4,209,267 |
|
Lockheed Martin Australia |
260 |
1,132,692 |
1,457,564 |
|
Fujitsu |
1092 |
961,386 |
1,041,298 |
|
Abacus Innovations |
133 |
893,707 |
1,052,543 |
|
Data#3 |
1689 |
883,030 |
902,807 |
|
Telstra Corporation |
1091 |
660,438 |
2,816,866 |
|
Hewlett Packard |
1517 |
597,180 |
658,655 |
|
FMS Account (Foreign Military Sales) |
50 |
585,944 |
10,350,755 |
|
Raytheon |
238 |
543,641 |
2,044,325 |
|
Thales |
783 |
535,597 |
6,411,119 |
|
Oracle Corporation |
674 |
532,681 |
544,065 |
|
Accenture |
127 |
485,423 |
1,190,205 |
|
Harris Corporation |
186 |
457,575 |
500,629 |
|
Elbit Systems |
39 |
443,450 |
454,976 |
|
Datacom Systems |
336 |
425,959 |
583,322 |
|
BAE Systems |
699 |
415,802 |
4,063,562 |
|
SAP Australia |
284 |
387,410 |
394,814 |
|
Optus |
281 |
344,821 |
567,897 |
|
Dell |
1457 |
335,238 |
361,040 |
|
Unisys |
61 |
318,332 |
352,844 |
|
CSC |
171 |
306,429 |
388,472 |
|
Dimension Data |
1225 |
306,361 |
461,873 |
Source: ANAO analysis of AusTender data.
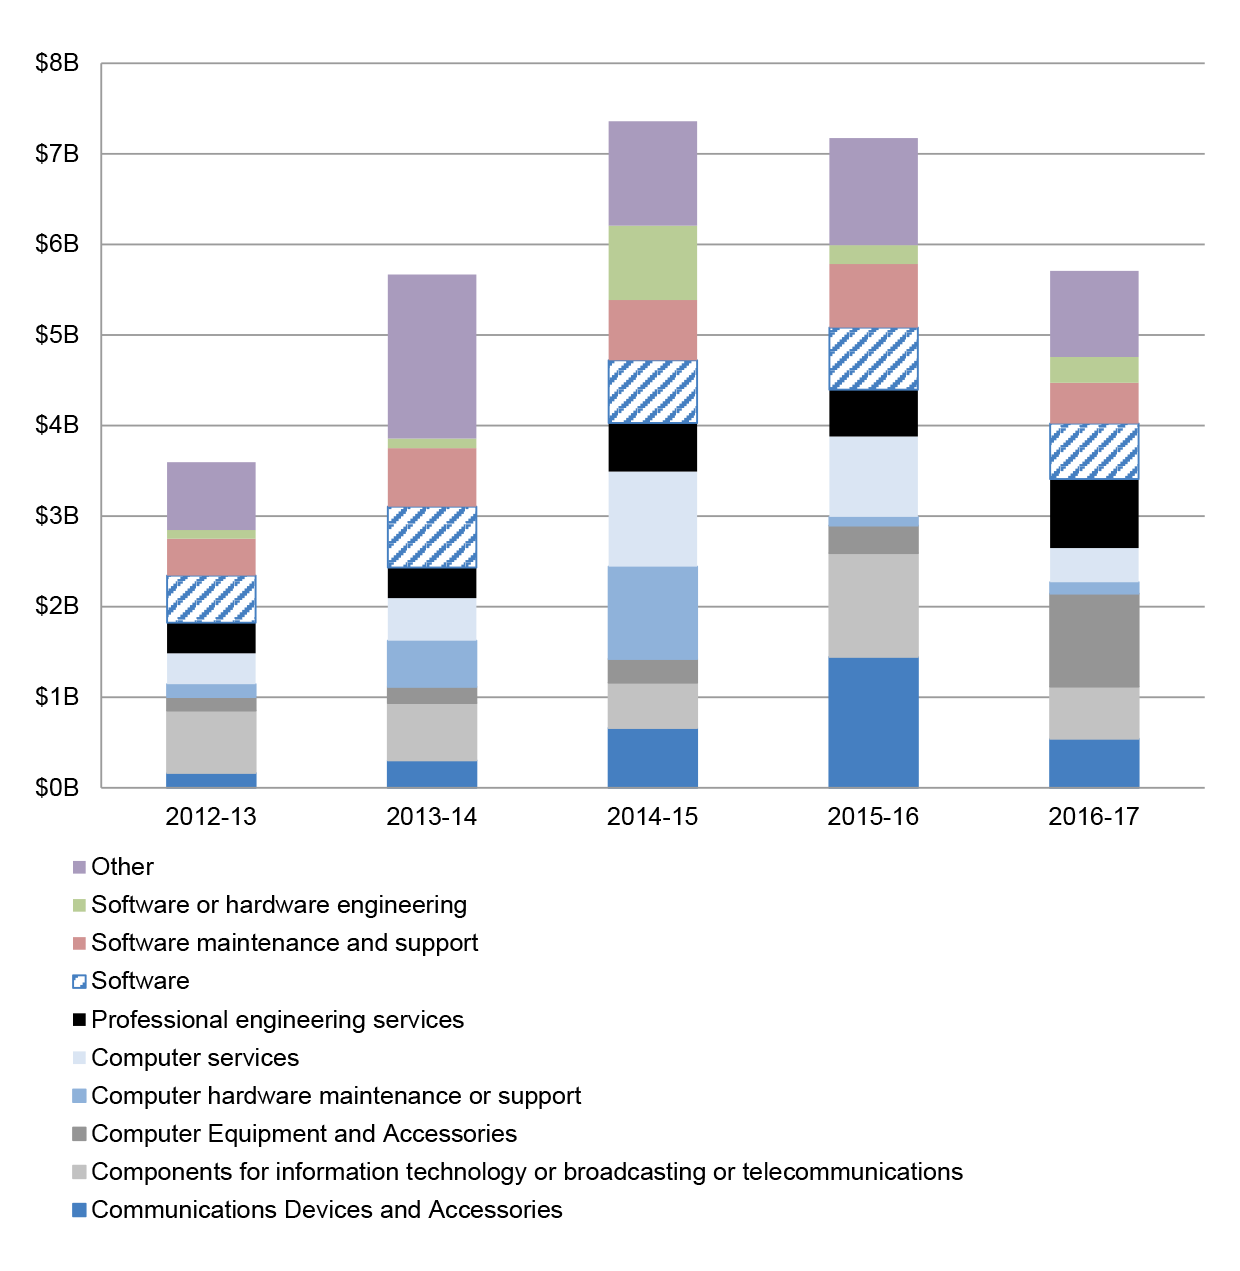
4.4 Figure 4.3 and Table 4.3 identify the largest product/service sub-categories within IT, Broadcasting, Telecommunications, or Engineering and Research and Technology Based Services by contract value in the last five financial years.
Figure 4.3: Largest product/service sub-categories within IT, broadcasting, telecommunications, or engineering and research and technology based services by financial year (2012–13 to 2016–17)26 27 28
Source: ANAO analysis of AusTender data.
Table 4.3: Largest product/service sub-categories within IT, broadcasting, telecommunications, or engineering and research and technology based services by financial year (2012–13 to 2016–17)29
|
Product/Service Sub-Category |
Contract Value ($000's) |
|
Components for information technology or broadcasting or telecommunications |
3,536,994 |
|
Software |
3,181,791 |
|
Computer services |
3,127,963 |
|
Communications Devices and Accessories |
3,120,587 |
|
Software maintenance and support |
2,873,133 |
|
Professional engineering services |
2,488,495 |
|
Computer Equipment and Accessories |
1,919,184 |
|
Computer hardware maintenance or support |
1,896,175 |
|
Software or hardware engineering |
1,515,304 |
|
Other |
5,845,218 |
|
Total |
29,504,845a |
Note a: Figures in table may not sum due to rounding.
Source: ANAO analysis of AusTender data.
5. Consultancies and management advice
5.1 Contracts relating to consultancies are required to be identified on AusTender via the use of a 'Consultancy Flag' field, together with the supporting reason for the consultancy. Guidance released by the Department of Finance indicates contracts should be reported as consultancies when:
- the contract involves the development of an intellectual output that assists with decision making;
- the intellectual output represents the independent view of the service provider; and
- the output is the sole or majority element of the contract in terms of relative value or importance.30
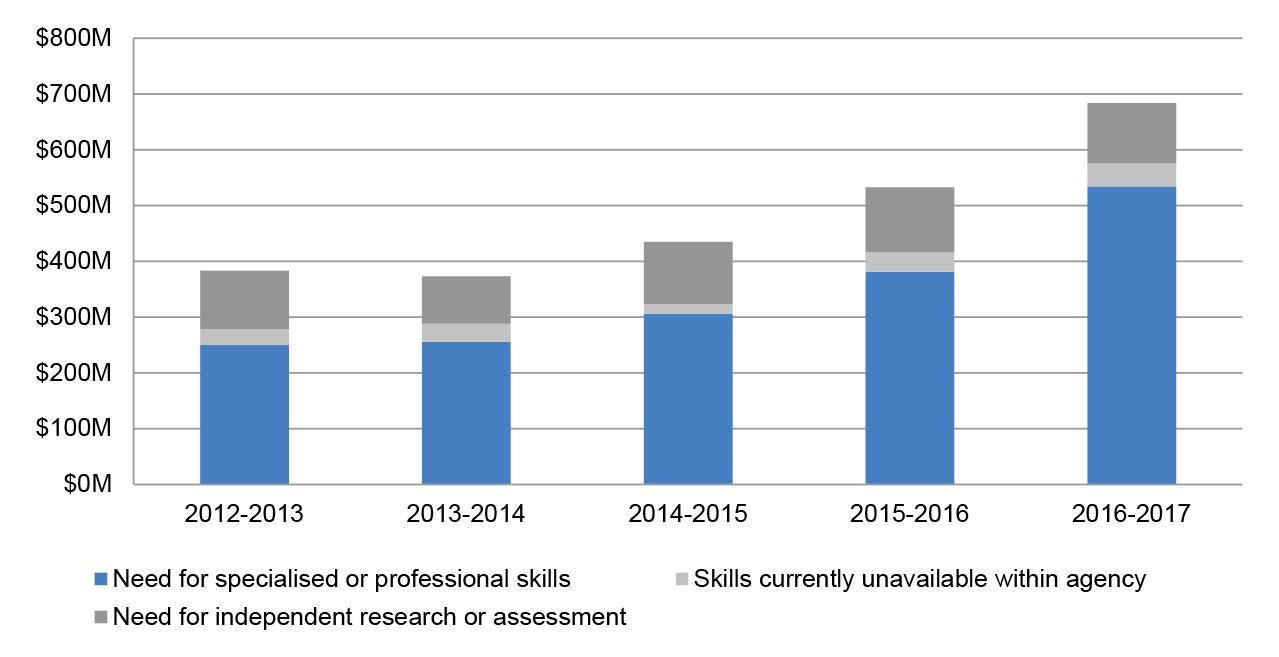
5.2 Entities are required identify the reason for the consultancy from the following list:
- need for specialised or professional skills;
- skills currently unavailable within agency; or
- need for independent research or assessment.
Figure 5.1: Consultancy contract value by consultancy reason and financial year (2012–13 to 2016–17)31
Source: ANAO analysis of AusTender data.
5.3 Table 5.1 identifies the largest suppliers by value of contracts flagged as consultancy in the last five financial years. The table also shows the total value of contracts that each supplier has received from government, regardless of whether it was flagged as a consultancy.
Table 5.1: Largest suppliers by value of consultancy contracts (2012–13 to 2016–17)
|
Supplier |
Number 'Consultancy' contracts per supplier |
Value of supplier 'Consultancy' contracts per supplier ($000's) |
Total value of supplier contracts ($000's) |
|
PwC |
411 |
174,439 |
523,532 |
|
Ernst & Young |
350 |
129,187 |
422,422 |
|
KPMG |
512 |
118,201 |
620,026 |
|
Deloitte |
344 |
80,320 |
364,818 |
|
Accenture |
22 |
39,014 |
1,190,205 |
|
URS Corporation |
219 |
29,883 |
906,403 |
|
Australian Government Solicitor |
588 |
29,499 |
480,454 |
|
Boston Consulting Group |
21 |
29,224 |
77,745 |
|
Clayton UTZ |
250 |
28,316 |
110,580 |
|
ASC (formerly the Australian Submarine Corporation) |
2 |
27,718 |
3,492,285 |
|
GHD |
91 |
25,593 |
190,056 |
|
Social Research Centre |
25 |
24,634 |
47,332 |
|
Watpac Construction |
1 |
23,975 |
406,662 |
|
St Hilliers Property |
1 |
23,755 |
232,814 |
|
Microsoft |
38 |
22,472 |
245,944 |
|
Partners In Performance |
2 |
19,901 |
19,901 |
|
Griffith University |
58 |
18,870 |
30,195 |
|
CSIRO |
116 |
18,479 |
138,887 |
|
DMV Consulting |
7 |
18,466 |
83,765 |
|
AECOM Services |
52 |
18,136 |
172,637 |
Source: ANAO analysis of AusTender data.
|
Supplier |
Number 'Consultancy' contracts per supplier |
Value of supplier 'Consultancy' contracts per supplier ($000's) |
Total value of supplier contracts ($000's) |
|
PwC |
411 |
174,439 |
523,532 |
|
Ernst & Young |
350 |
129,187 |
422,422 |
|
KPMG |
512 |
118,201 |
620,026 |
|
Deloitte |
344 |
80,320 |
364,818 |
|
Accenture |
22 |
39,014 |
1,190,205 |
|
URS Corporation |
219 |
29,883 |
906,403 |
|
Australian Government Solicitor |
588 |
29,499 |
480,454 |
|
Boston Consulting Group |
21 |
29,224 |
77,745 |
|
Clayton UTZ |
250 |
28,316 |
110,580 |
|
ASC (formerly the Australian Submarine Corporation) |
2 |
27,718 |
3,492,285 |
|
GHD |
91 |
25,593 |
190,056 |
|
Social Research Centre |
25 |
24,634 |
47,332 |
|
Watpac Construction |
1 |
23,975 |
406,662 |
|
St Hilliers Property |
1 |
23,755 |
232,814 |
|
Microsoft |
38 |
22,472 |
245,944 |
|
Partners In Performance |
2 |
19,901 |
19,901 |
|
Griffith University |
58 |
18,870 |
30,195 |
|
CSIRO |
116 |
18,479 |
138,887 |
|
DMV Consulting |
7 |
18,466 |
83,765 |
|
AECOM Services |
52 |
18,136 |
172,637 |
Source: ANAO analysis of AusTender data.
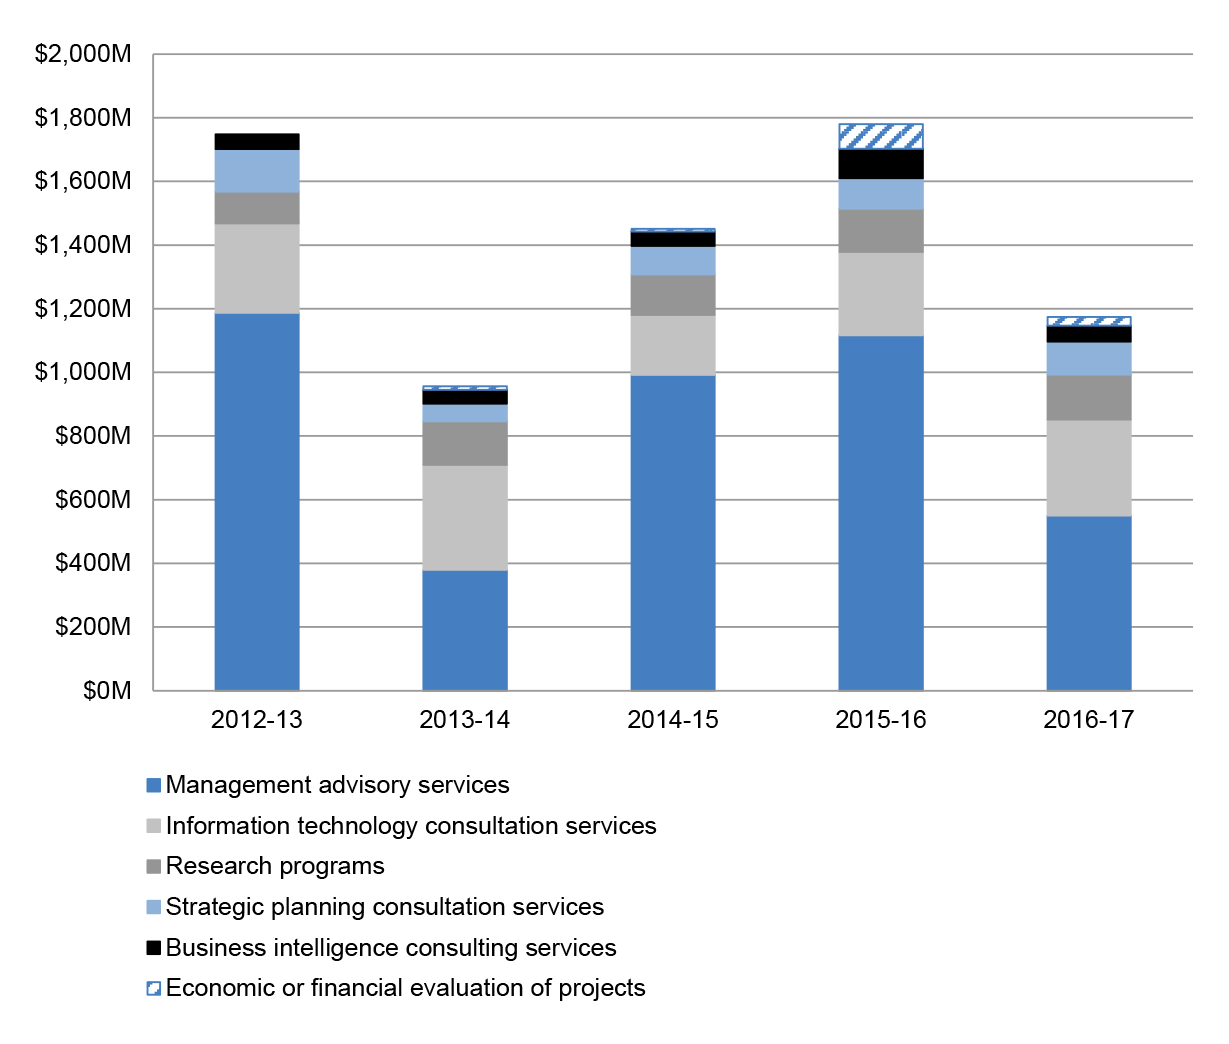
5.4 ANAO identified the largest six product and services sub-categories with contracts flagged as consultancies.32 These categories make up approximately 47 per cent of the value of contracts flagged as consultancies. However, almost 85 per cent of contract value in these categories belongs to contracts not flagged in AusTender as consultancy. The following analysis shows the contract value of these six service categories, regardless of the consultancy flag.
Figure 5.2: Largest six advisory and consultation categories by financial year (2012–13 to 2016–17)33
Source: ANAO analysis of AusTender data.
5.5 Using the six categories identified above, Table 5.2 shows the largest suppliers by the value of contracts in these categories. The table also shows the total value of contracts for each supplier regardless of product/service category.
Table 5.2: Largest suppliers by value of contracts for the largest six advisory and consultation categories34 (2012–13 to 2016–17)
|
Supplier |
Number of contracts per supplier (contracts in the largest six advisory and consultation categories) |
Contract value per supplier (contracts in the largest six advisory and consultation categories) ($000's) |
Contract value per supplier (all categories) ($000's) |
|
Cardno |
42 |
466,973 |
867,688 |
|
Accenture |
83 |
309,192 |
1,190,205 |
|
Colin Joss & Co |
3 |
305,524 |
352,615 |
|
Abt JTA |
20 |
302,403 |
761,901 |
|
Serco Global Services |
1 |
246,646 |
246,646 |
|
KPMG |
539 |
192,484 |
620,026 |
|
PwC |
367 |
186,613 |
523,532 |
|
SMEC International |
4 |
177,723 |
318,792 |
|
Ernst & Young |
303 |
163,274 |
422,422 |
|
Baulderstone Hornibrook |
2 |
162,946 |
425,137 |
|
Deloitte |
364 |
149,427 |
364,818 |
|
Bechtel Management |
2 |
107,132 |
107,132 |
|
Stellar Asia Pacific |
1 |
96,263 |
96,263 |
|
Palladium International |
13 |
87,463 |
491,544 |
|
GRM International |
28 |
87,355 |
112,617 |
|
URS Corporation |
44 |
63,312 |
906,403 |
|
DMV Consulting |
28 |
59,371 |
83,765 |
|
Salmat |
3 |
56,056 |
75,136 |
|
Microsoft |
95 |
55,104 |
245,944 |
|
Nova |
34 |
55,064 |
353,188 |
Source: ANAO analysis of AusTender data.
5.6 For both suppliers and service categories with the largest value of contracts flagged as consultancies, analysis in this chapter shows a substantial difference in the value of contracts identified in AusTender using the 'consultancy' flag and the total value of contracts for the identified suppliers and categories.
5.7 Many of these suppliers publically report consultancy as a substantial component of their business. Contracts with these suppliers and contracts in service categories including 'management advisory services' and 'information technology consultation services' have the vast majority (by value) classified as not being consultancy. This may suggest entities have under-reported consultancy contracts.
5.8 Analysis of individual contracts with respective entities would be required to determine the extent to which consultancy contracts are being accurately reported in AusTender using the 'consultancy' flag.
Procurement contracts with the 'big four' accounting firms
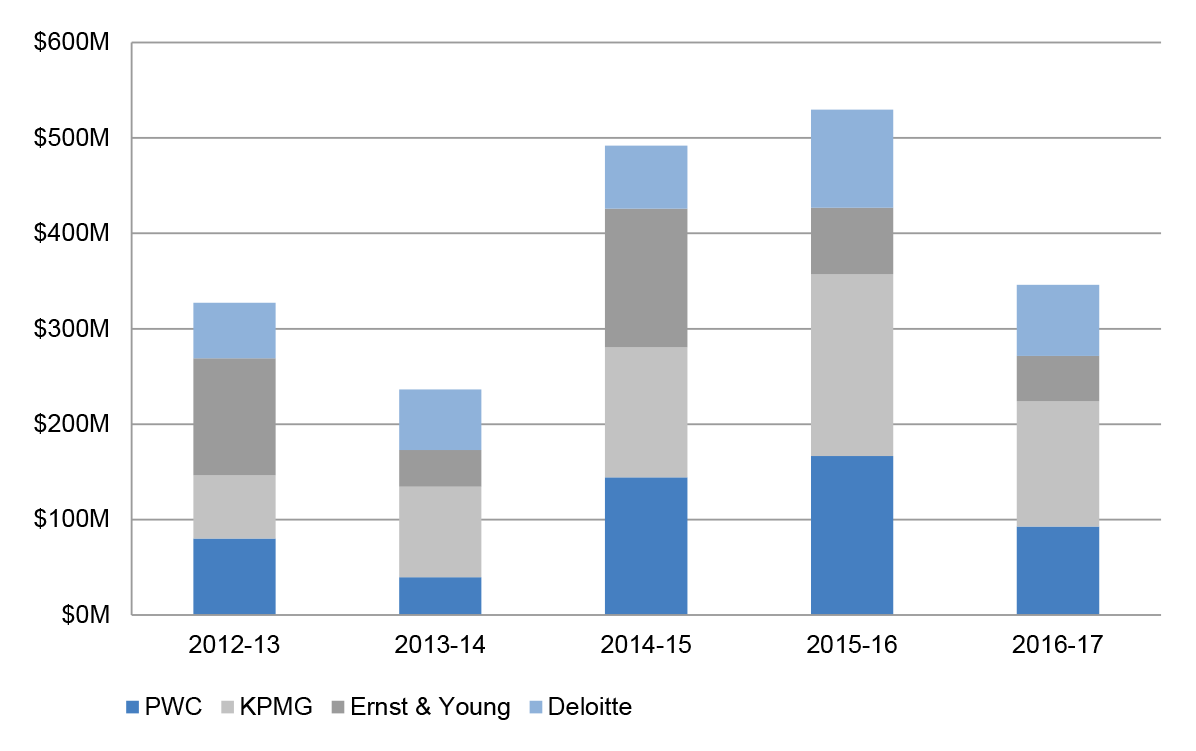
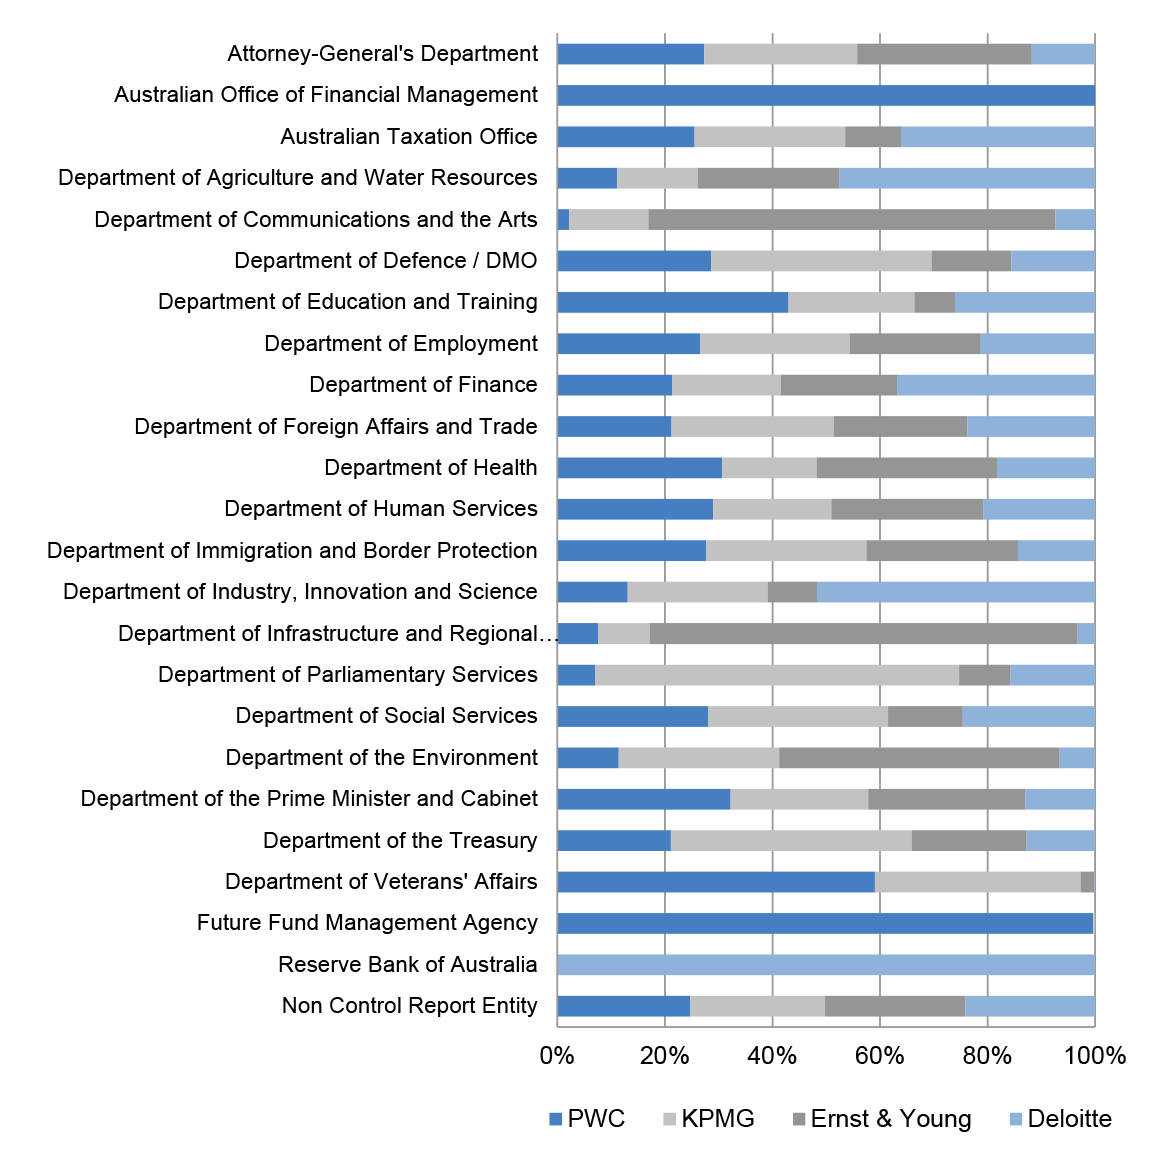
5.9 This section shows procurement contracts with the 'big four' Accounting firms as identified using a combination of ABNs and name matching.
Figure 5.3: Contract value with 'big four' accounting firms by financial year (2012–13 to 2016–17)35 36
Source: ANAO analysis of AusTender data.
Figure 5.4: Proportion of 'big four' contract value by entity (2012–13 to 2016–17)37
Source: ANAO analysis of AusTender data.
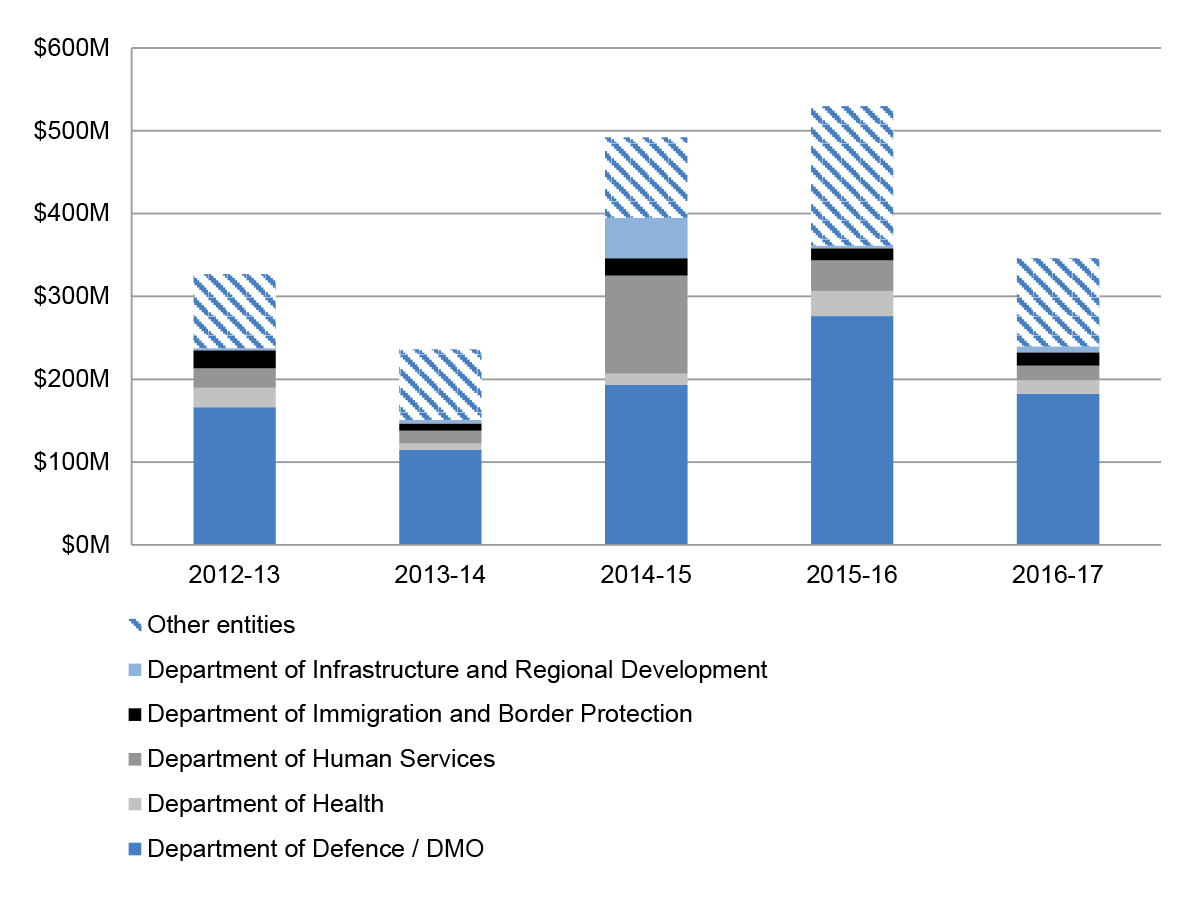
5.10 The following analysis shows the contract value with the 'big four' accounting firms by the largest five entities as determined by total contract value with the 'big four' in the period 2012–13 to 2016–17. All entities not in the largest five have been grouped as 'Other entities'.
Figure 5.5: Contract value with 'big four' by largest five entities by financial year (2012–13 to 2016–17)38
Source: ANAO analysis of AusTender data.
6. Financial year procurement contract trends
6.1 The ANAO analysed contracts in the period 2012–13 to 2016–17 to identify the number and value of contracts commencing by month. Figure 6.1 shows that for all contracts over the last five financial years, while there is an increase in the number of procurements towards the end of the financial year, more contracts commence in July than in any other month.
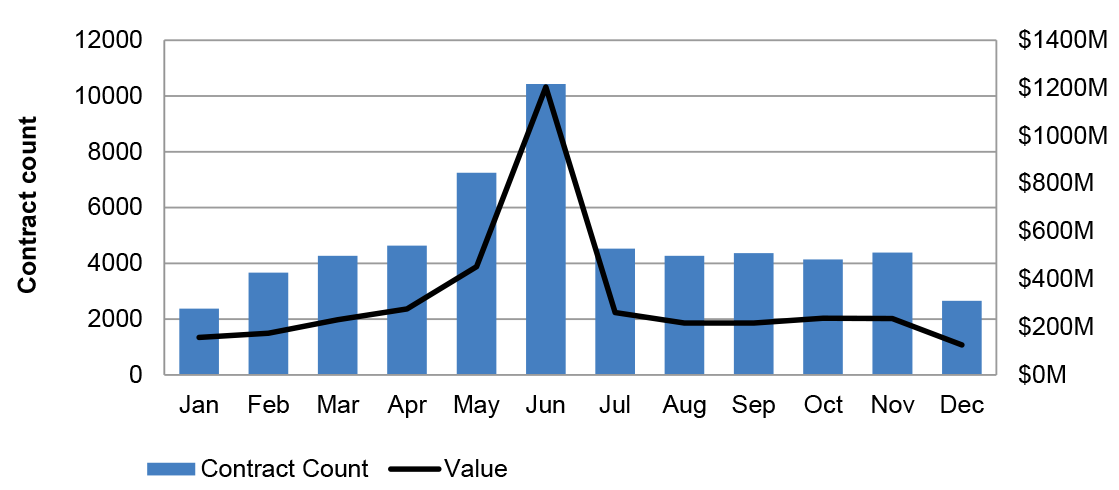
6.2 However, when looking only at short-term contracts39, there is a significant increase in the number of contracts that commence in the final month of the financial year (Figure 6.2).
Figure 6.1: Contract commencement: All contracts by month start date (2012–13 to 2016–17)
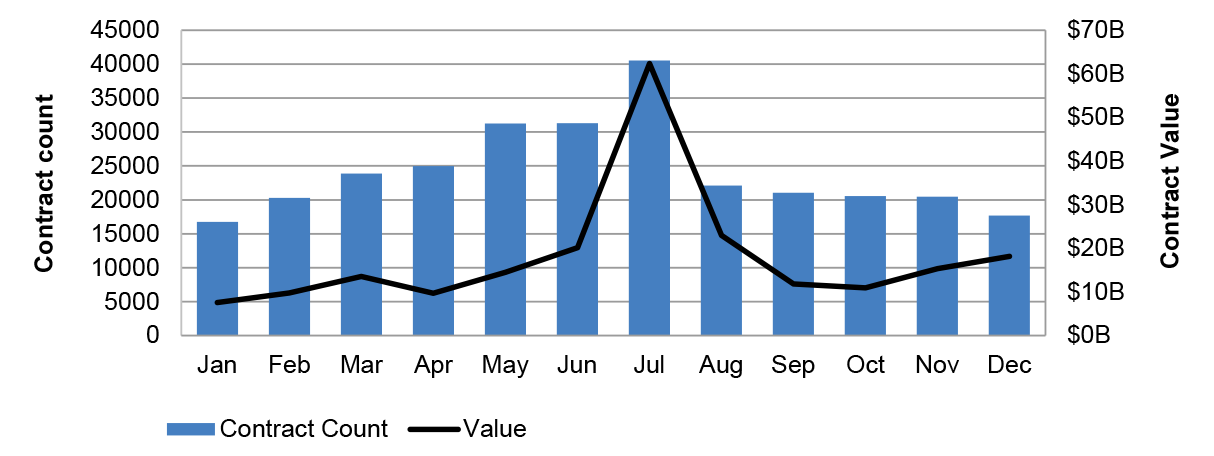
Figure 6.2: Contract commencement: Short-term contracts by month start date 2012–13 to 2016–17)
Source: ANAO analysis of AusTender data.
6.3 At the Whole-of-Government level, this represents an increase from an average of 845 short term contracts per month in July thru May to an average of 2084 in June (a 147 per cent increase). The value of short-term contracts entered into in June is also higher than the value of contracts entered into in each of the other months.
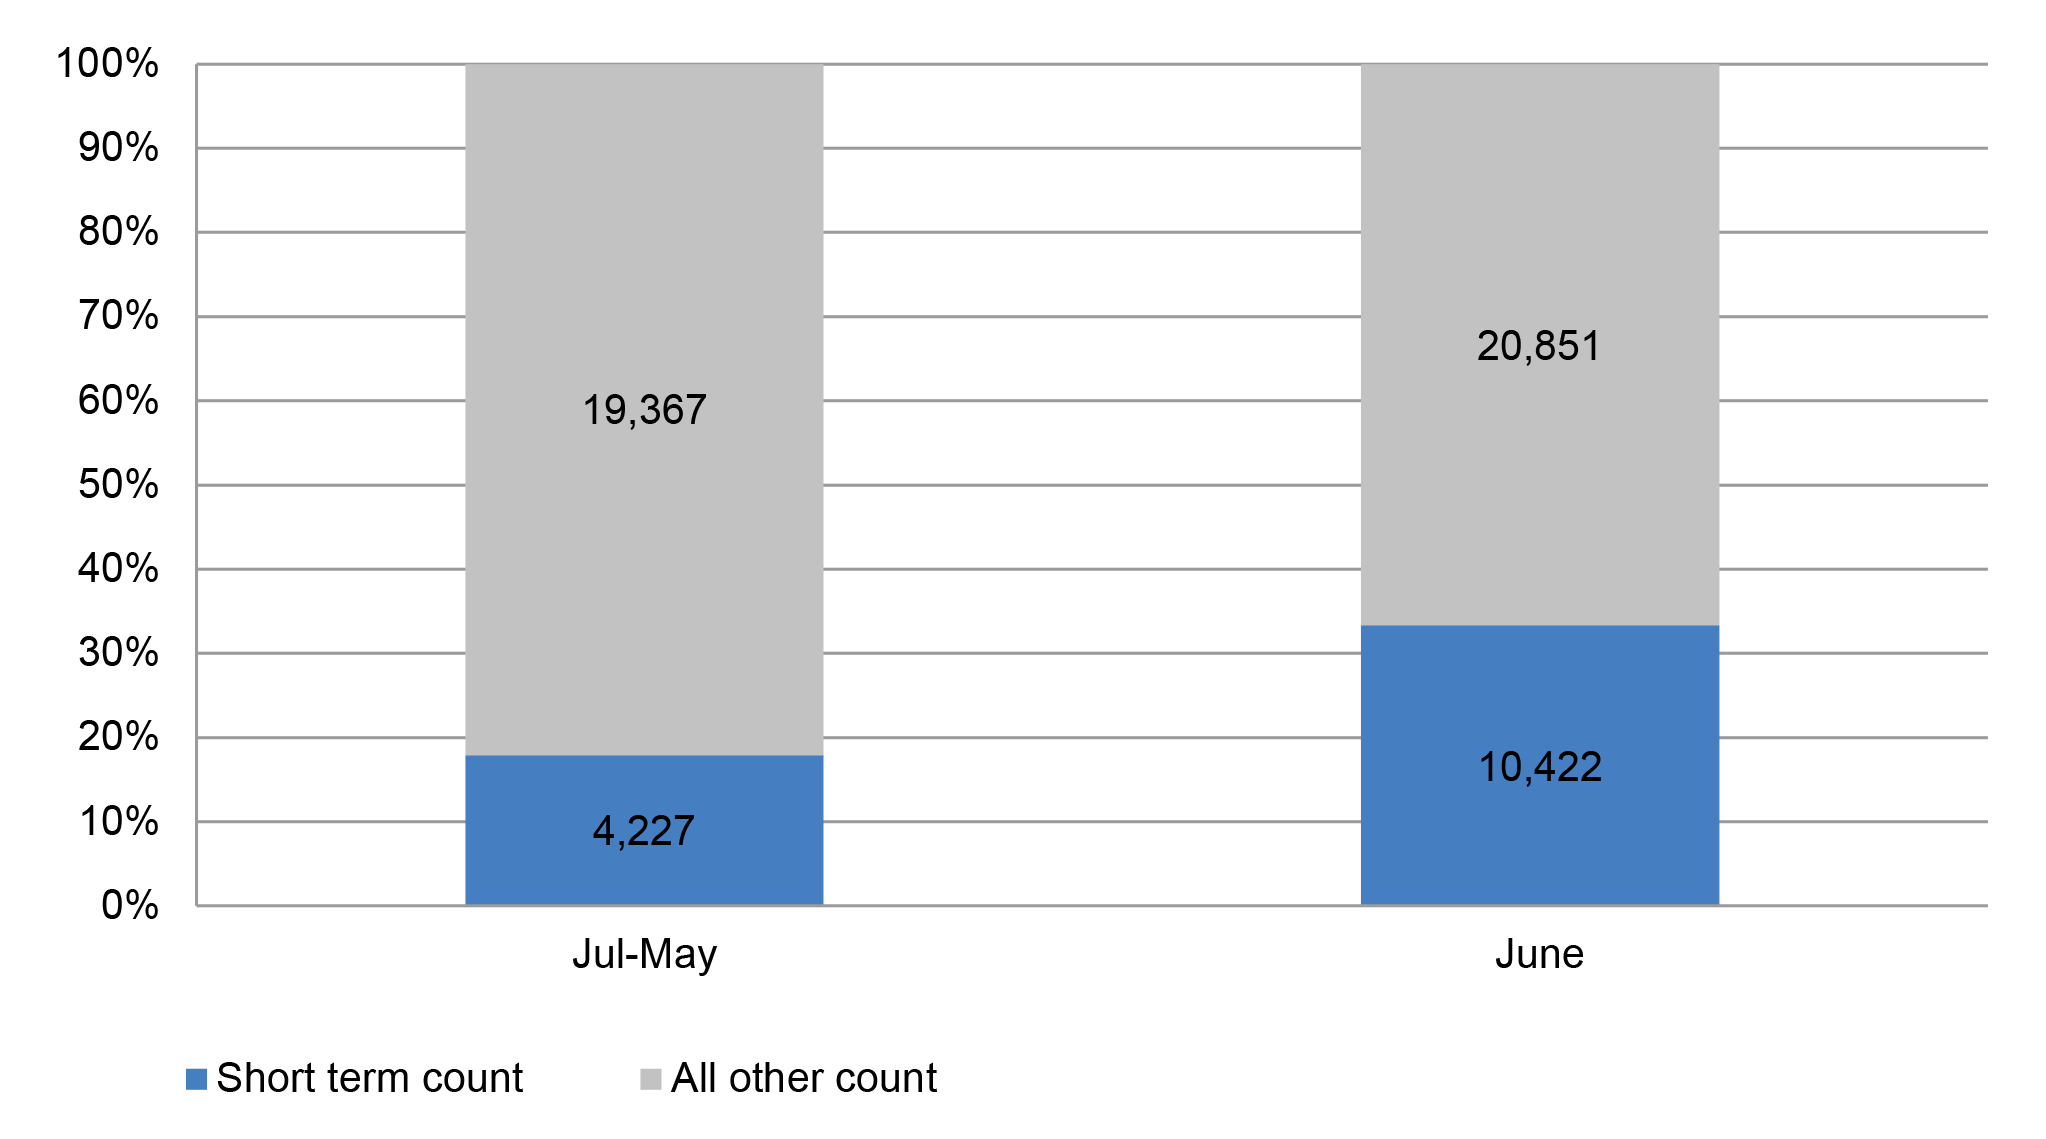
6.4 Figure 6.3 shows the relative proportion (by number) of short-term and all other contracts in June compared to the proportion of short term contracts in all other months.
Figure 6.3: Proportion of contracts (by number) commencing in June compared to the rest of the year (2012–13 to 2016–17)
Source: ANAO analysis of AusTender data.
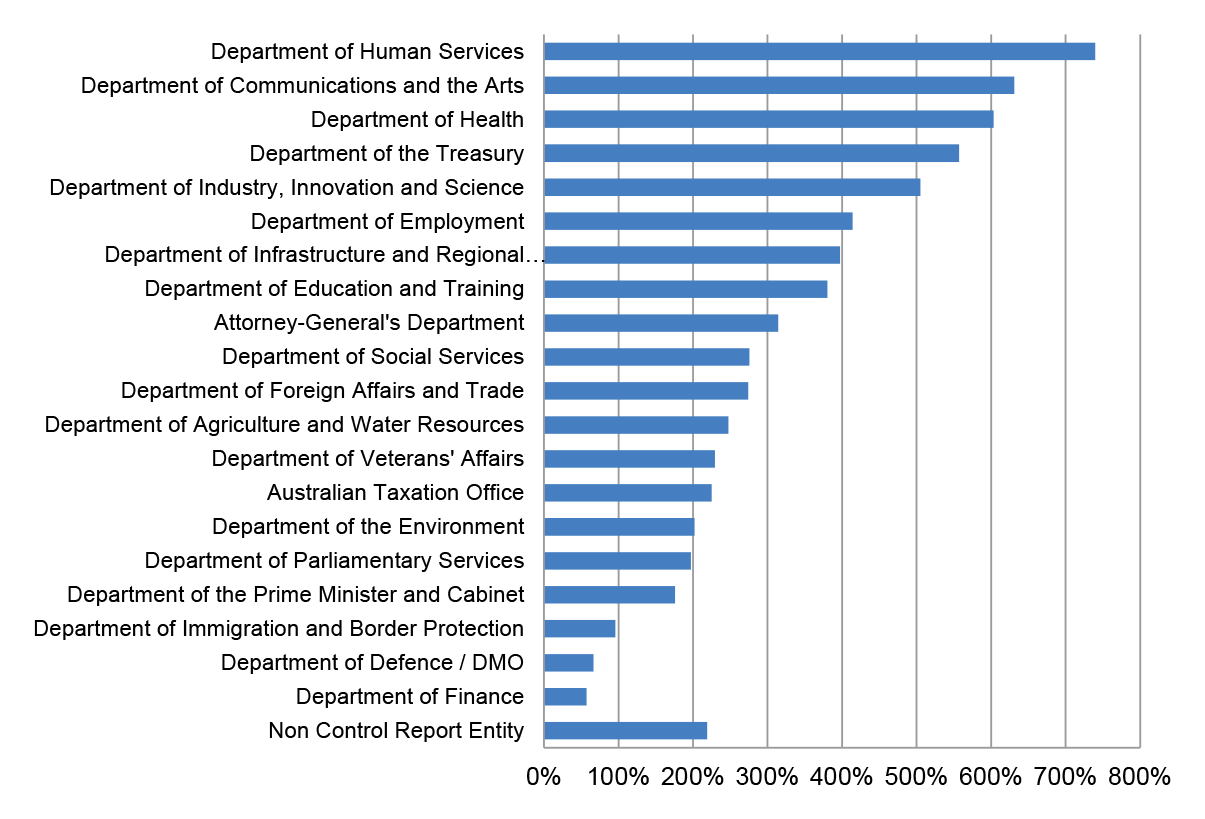
6.5 Figure 6.4 shows the percentage increase in short-term contracts between July–May and June by entity. While all 20 Control Report entities in the analysis40 had an increase in short term contracts in June, the extent varied considerably, ranging from 57 per cent to over 700 per cent increases.
Figure 6.4 Percentage increase in June short term contracts for selected control report entities41 (2012–13 to 2016–17)
Source: ANAO analysis of AusTender data.
7. Procurement contract thresholds
7.1 For non-corporate Commonwealth entities (other than for procurements of construction services), when the expected value of a procurement is at or above $80,000, additional rules in Division 2 of the CPRs must also be followed. Primarily, this requires that except under specified circumstances, procurements must be conducted by an open approach to the market.
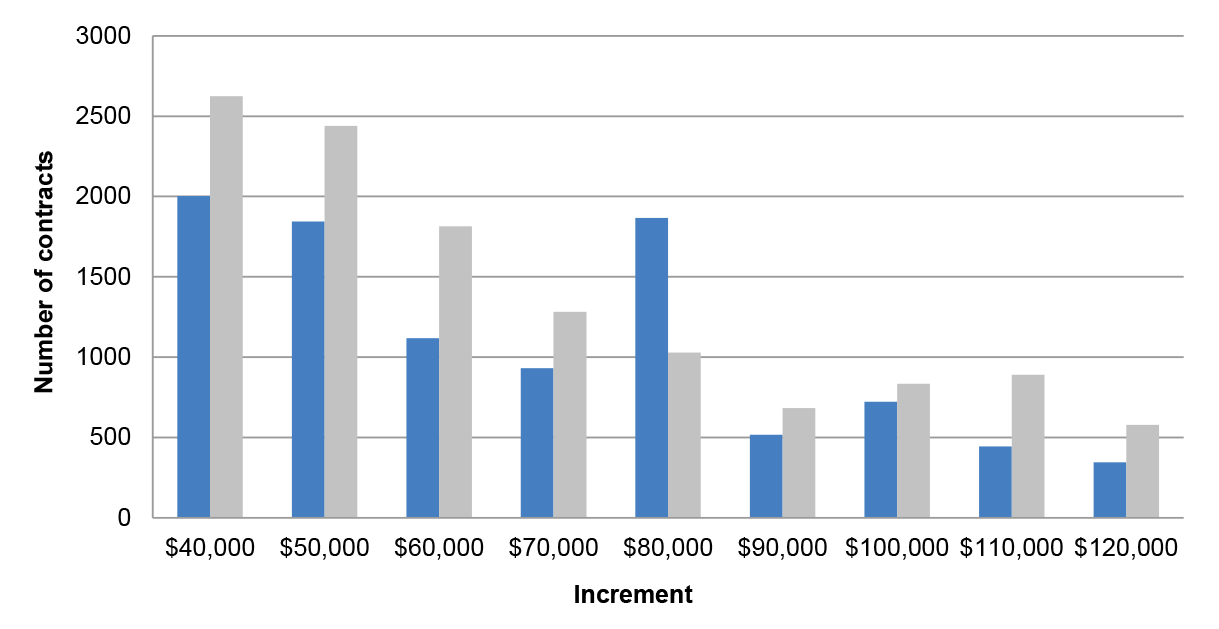
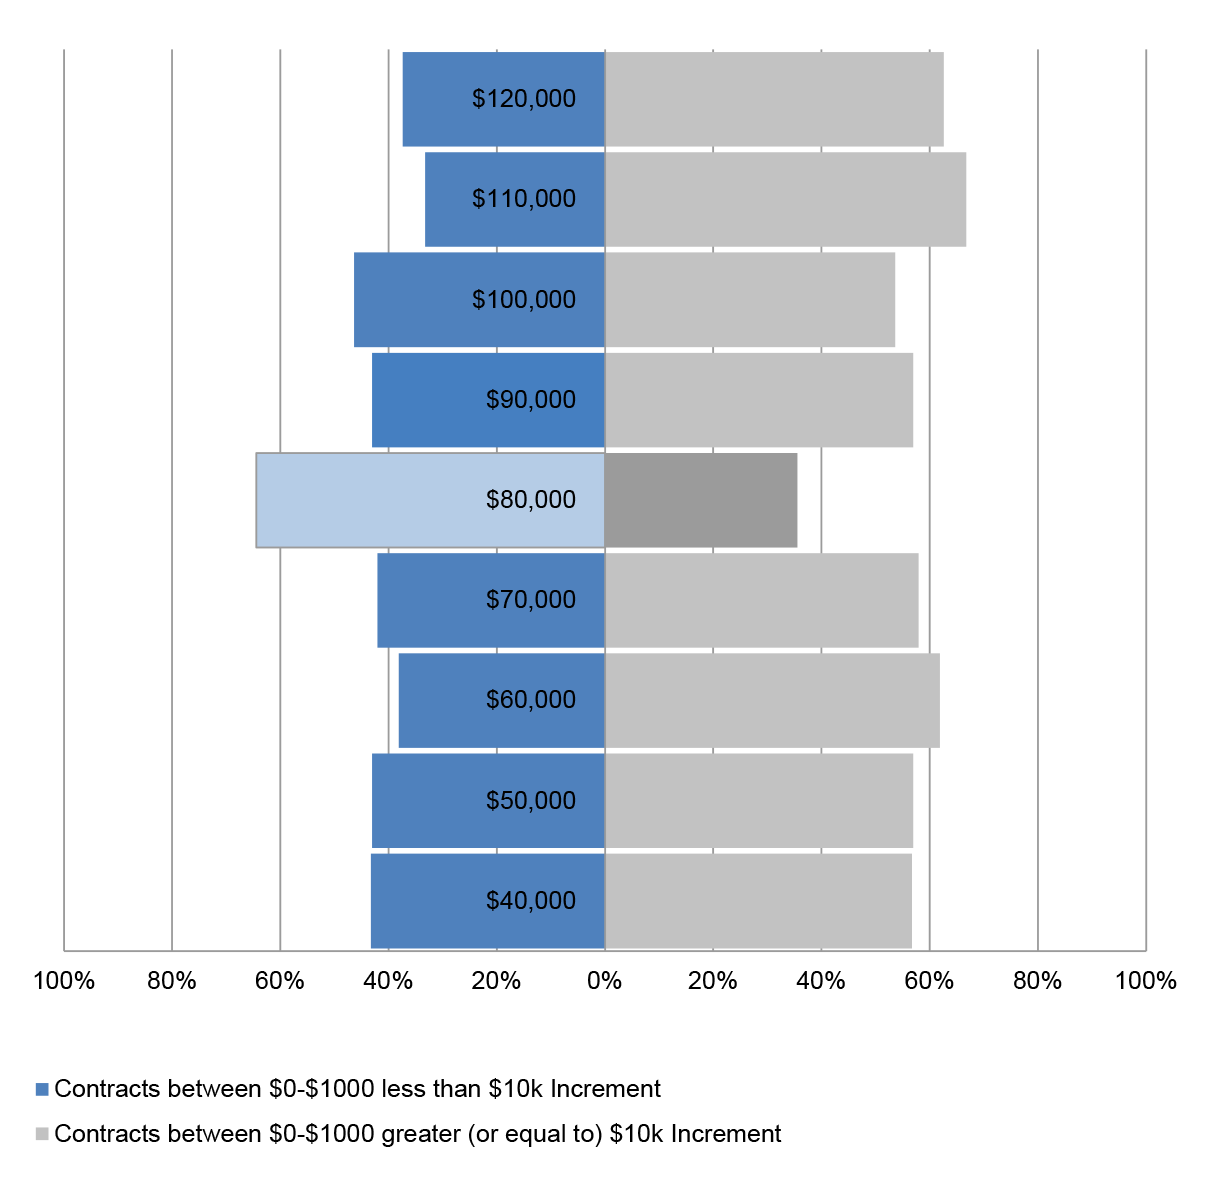
7.2 The following analysis shows the distribution of reported contract values within $1000 of each $10,000 increment – that is, how many reported contracts are just below the $10,000 increment, and how many are just above. For all $10,000 increments, there are more contracts above the increment than below, except for the $80,000 threshold.
Figure 7.1: Number of contracts within $1000 of $10,000 Increments ($40,000 to $120,000 – FY 2012–13 to 2016–2017)
Source: ANAO analysis of AusTender data.
Figure 7.2: Percentage of contracts with values within $1000 of increments of $10,000 ($40,000 to $120,000 – 2012–13 to 2016–17)
Source: ANAO analysis of AusTender data.
7.3 The CPRs state that 'a procurement must not be divided into separate parts solely for the purpose of avoiding a relevant procurement threshold'.42 ANAO conducted analysis to identify sets of two contracts that had the following characteristics:
- both contracts were with the same entity;
- each of the contracts were entered into with the same supplier;
- the contracts had a start-date within the same quarter; and
- the combined value of the two contracts was above $80,000, but each of the reported contract values were below $80,000.
7.4 The ANAO identified 4914 individual contracts (or 2457 pairs of contracts) that met the above criteria.
Table 7.1: 'Potentially related' contracts (2012–13 to 2016–17)
|
Financial year of contract start date |
Number of 'potentially related' contract pairs |
Number of contracts with a value of $80,000-$160,000 |
|
2012–13 |
521 |
6111 |
|
2013–14 |
472 |
6022 |
|
2014–15 |
501 |
6766 |
|
2015–16 |
475 |
6969 |
|
2016–17 |
488 |
6656 |
|
Total |
2457 |
32524 |
Source: ANAO analysis of AusTender data.
7.5 The ANAO further analysed these 4914 contracts in order to categorise the pairs by whether one or both of the contracts identified as having an Open Tender43 process.
Table 7.2: 'Potentially related' contracts by procurement method (2012–13 to 2016–17)
|
Procurement method |
Number of 'potentially related' contract pairs |
Number of contracts |
|
At least one contract identified as Open Tender |
950 |
1900 |
|
Neither contract identified as Open Tender |
1507 |
3014 |
|
Total |
2457 |
4914 |
Source: ANAO analysis of AusTender data.
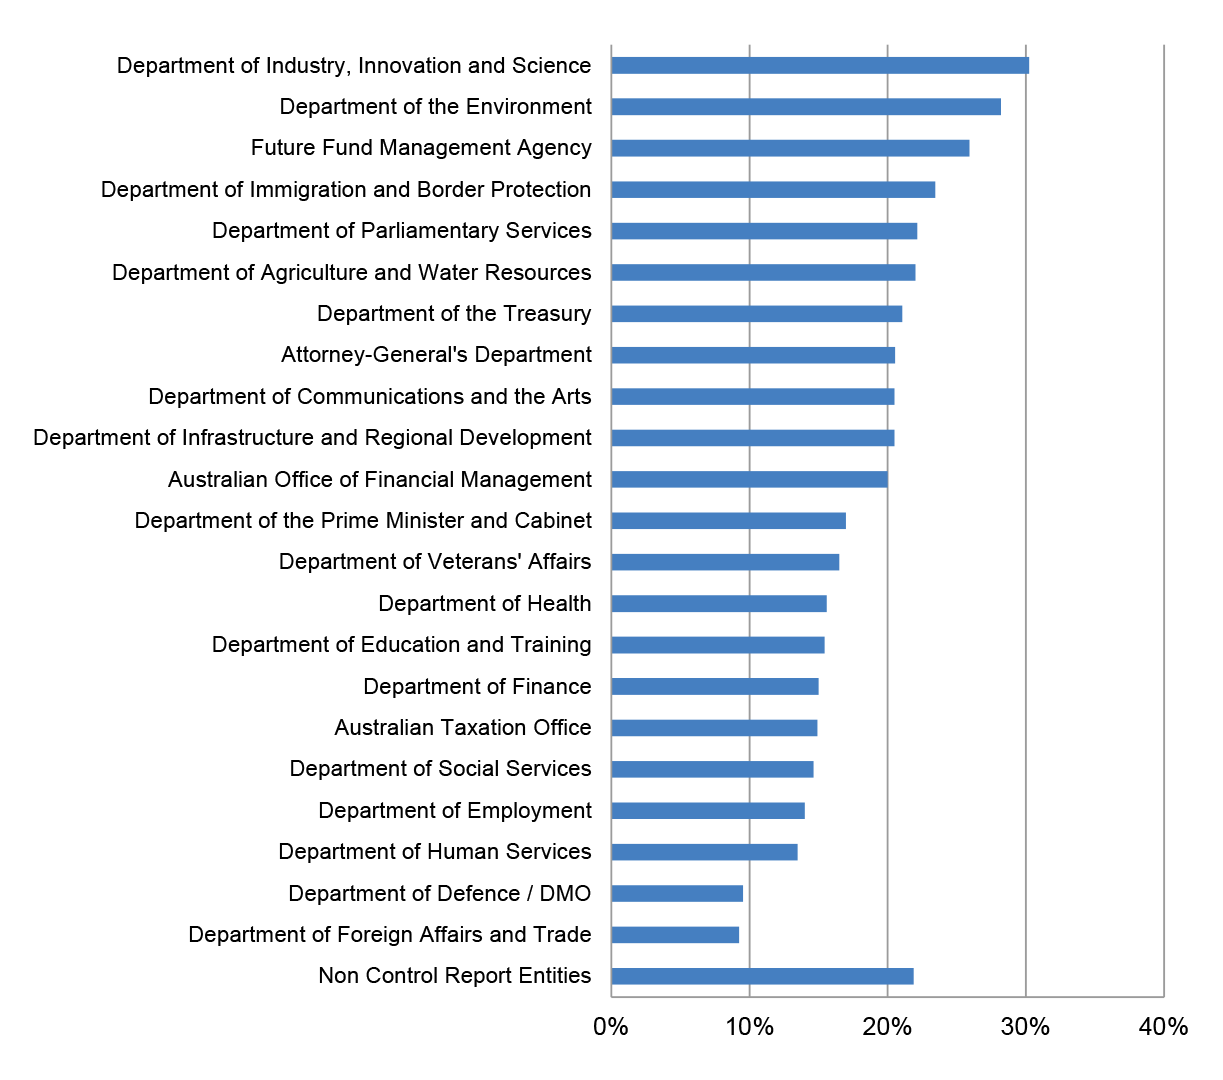
Figure 7.3: Potentially related contracts under $80,000 as a percentage of contracts between $80,000 and $160,000 by entity (2012–13 to 2016–17)
Source: ANAO analysis of AusTender data.
7.6 Individual analysis of each contract would be required to determine whether these reflected:
- contracts for discrete procurements;
- data errors (such as duplicate entries); or
- if a single procurement had been split into smaller contracts in order to fall below the procurement threshold.
8. Accuracy and timeliness of procurement contract notice publication
Potential duplicate contract entries on AusTender
8.1 In addition to the analysis of potentially related contracts in Chapter 6, ANAO also identified a number of transactions with characteristics indicating the contract may have been mistakenly reported on AusTender multiple times. These contracts had the characteristics of:
- same entity;
- same supplier ABN (or supplier name where no ABN)
- same start date; and
- identical contract value.
8.2 In order to better identify potential duplicate entries on AusTender, unlike other sections of the report, this analysis has not aggregated related contracts where there were matching key fields in AusTender.
8.3 Results of this analysis indicate that almost two per cent of contracts reported on AusTender may be duplicate entries.44 This would have the effect of overstating reported AusTender procurement value, on average, more than $100 million per year (approximately 0.25 per cent).
8.4 This analysis would not identify instances where one of the contracts in a potential duplicate entry has been amended subsequent to its original publication.
8.5 Further analysis would be required to identify instances where entities contracts were validly reported reflecting goods or services being procured at the same price, on the same day, on multiple occasions from the same supplier.
Table 8.1: Estimated number and value of potential duplicate entries on AusTender
|
Financial Year |
Number of potential duplicate contract entries |
Contract value of potential duplicate contract entries ($000's) |
|
2012–13 |
1261 |
99,715 |
|
2013–14 |
1235 |
163,972 |
|
2014–15 |
1376 |
95,079 |
|
2015–16 |
1241 |
133,606 |
|
2016–17 |
1245 |
91,068 |
|
Total |
6358 |
583,441a |
Note a: Figures in table may not sum due to rounding.
Source: ANAO analysis of AusTender data.
8.6 ANAO identified that two UNSPC categories make up a disproportional value of the potential duplicate entries. While contracts classified as 'Temporary Personnel Services' and 'Computer Services'45 account for only 2.35 per cent of total contract value, they account for 29.9 per cent of the total value of contracts identified as potential duplicate entries. ANAO's understanding is that these categories of contracts may be less likely to reflect duplicate entries as entities may enter into multiple contracts with supplier firms for staff contracted for the same period of time at the same rate.
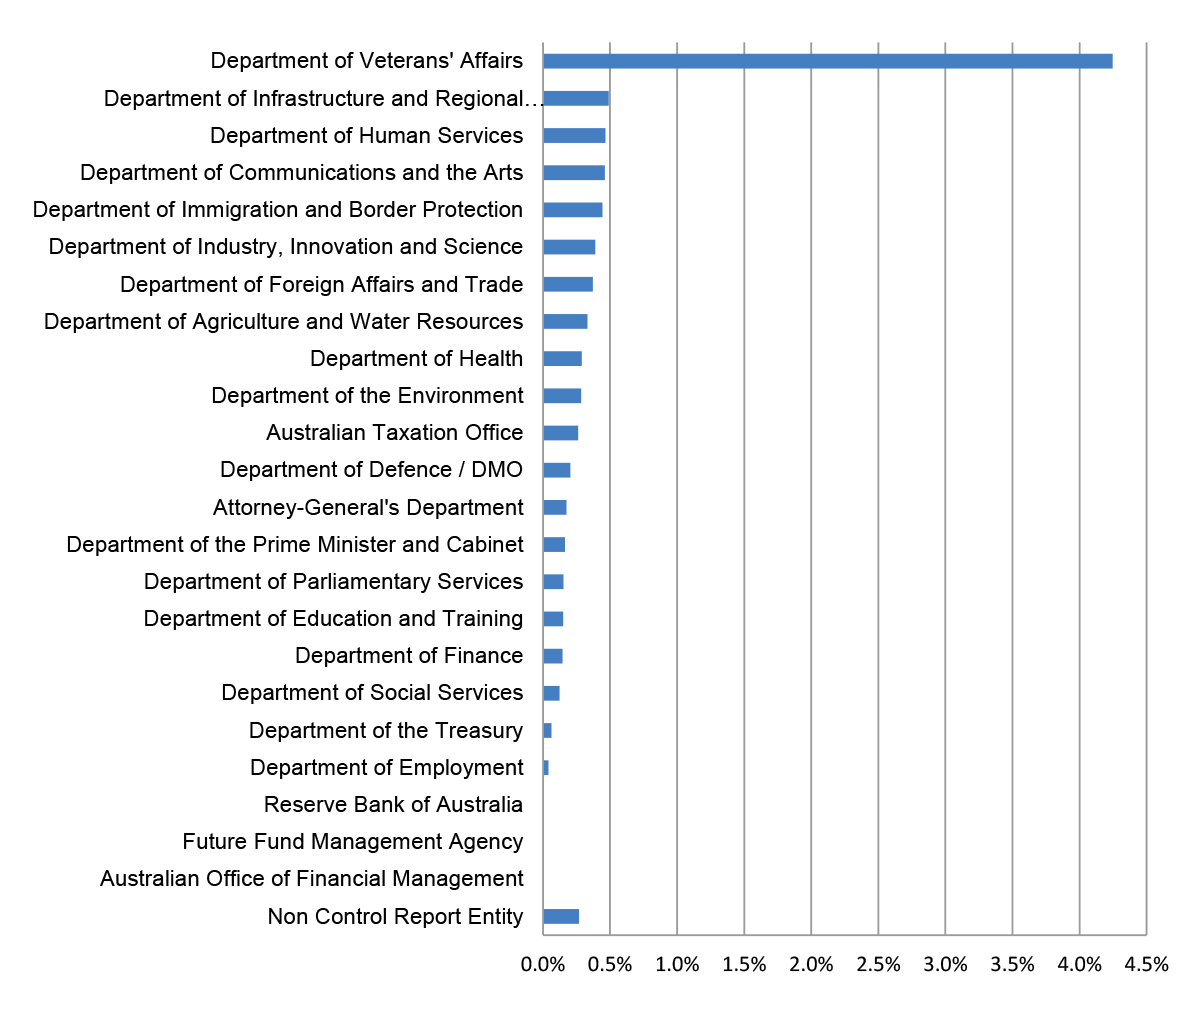
Figure 8.1: Estimated value of potential duplicate entry AusTender contracts as a percentage of total contract value by entity (2012–13 to 2016–17)
Source: ANAO analysis of AusTender data.
8.7 It should be noted that the Department of Veterans' Affairs had 29 per cent of its contract value in the categories 'Temporary Personnel Services' and 'Computer Services'. This is approximately 12 times higher than the Whole-of-Government average for these categories at 2.35 per cent.
8.8 As discussed previously, this may account for much of the reason why the Department of Veterans' Affairs has a 4.25 per cent value of potential duplicate entries compared with the 0.25 per cent Whole-of-Government average.
Timeliness of AusTender publication
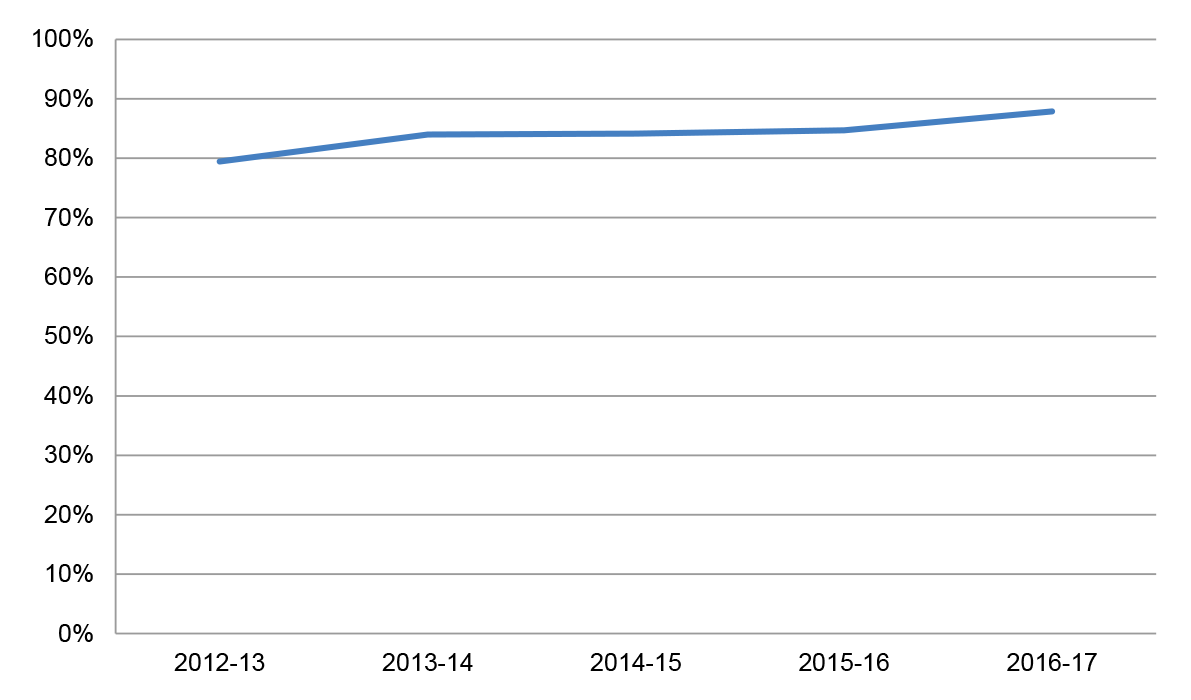
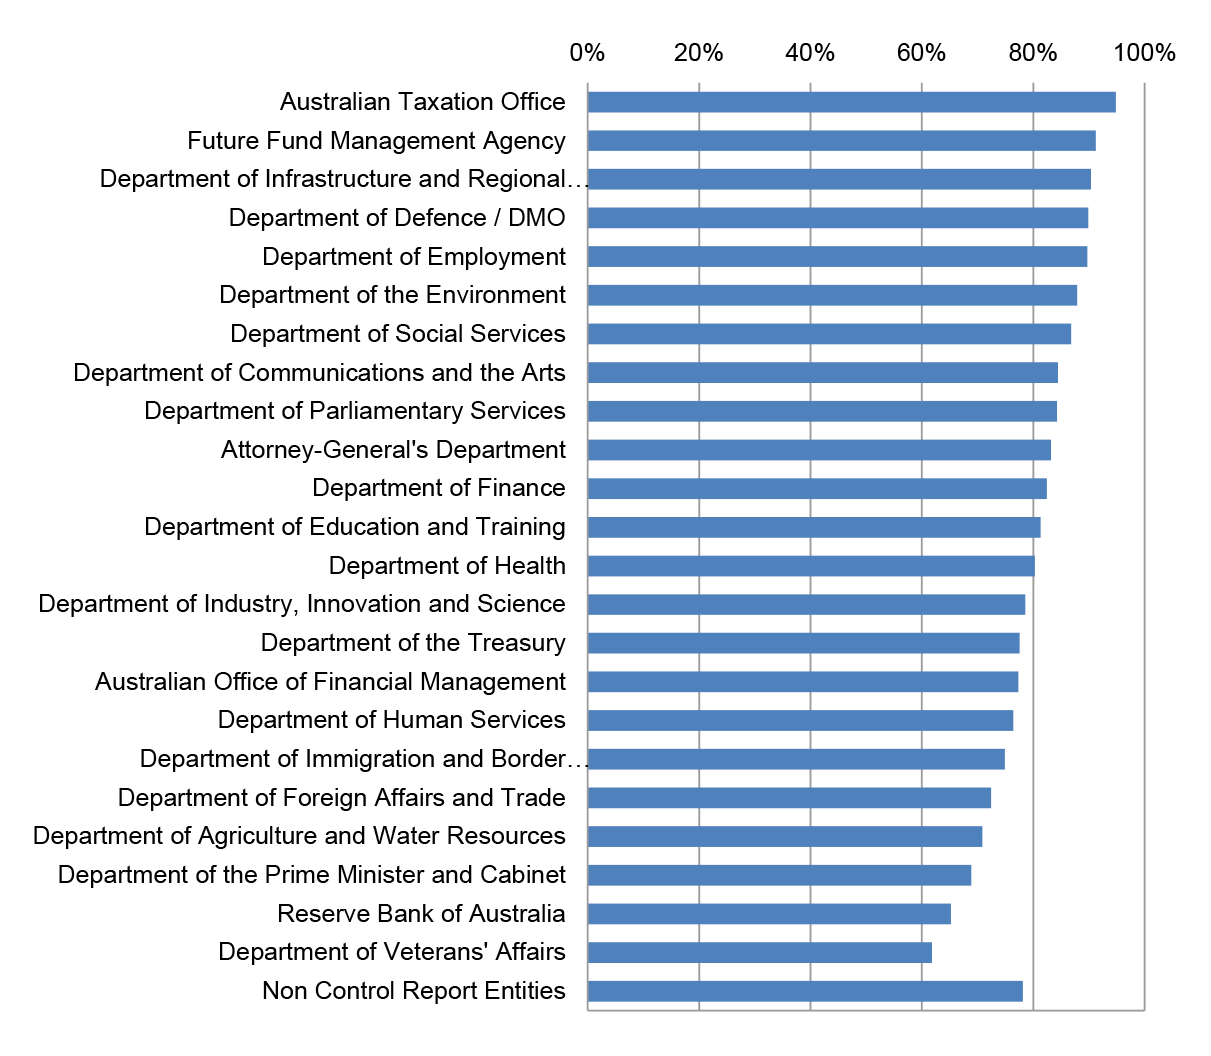
8.9 The CPRs state that relevant entities must report contracts and amendments on AusTender within 42 days of entering into (or amending) a contract if they are valued at or above the reporting threshold. 46 47
8.10 Figures 8.2 and 8.3 show compliance with the 42 day publishing rule. AusTender does not capture the date on which contracts are entered into. It is possible for entities to notify a contract start date that is later than the date on which the contract is entered into (6.5 per cent of contracts list a start date after the publish date). Consequently, where:
- the contract was not published on AusTender within the 42 days of the contract having been entered into; but
- the publication nonetheless occurred within 42 days after the contract start date;
this analysis will treat the contract notice as having met the 42 day publishing rule.
8.11 The following analysis includes only transactions where the publish date is on or after the start date.
Figure 8.2: Percentage of contracts published within 42 days of the contract start date by financial year (2012–13 to 2016–17)
Source: ANAO analysis of AusTender data.
Figure 8.3: Percentage of contracts published to AusTender within 42 days of the contract start date by entity (2012–13 to 2016–17).
Source: ANAO analysis of AusTender data.
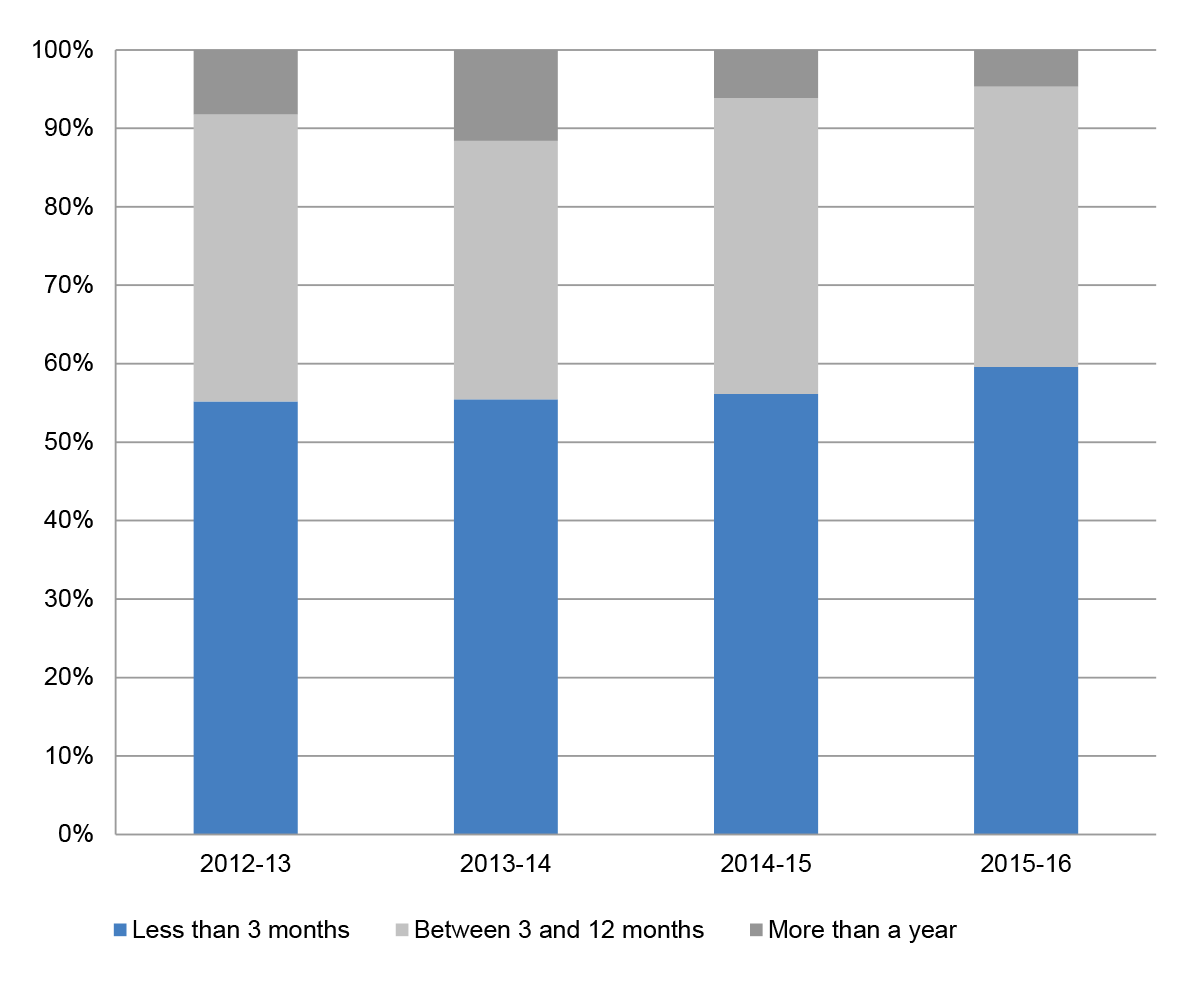
8.12 Figure 8.4 shows a stratification of the time taken to publish to AusTender, only those contracts that were not compliant with the 42 day publishing requirement (I.e. those where the publish date was more than 42 days after the contract start date).
Figure 8.4: Stratification of contracts published more than 42 days after start date by financial year (2012–13 to 2015–16)48
Source: ANAO analysis of AusTender data.
9. Procurement contracts by location
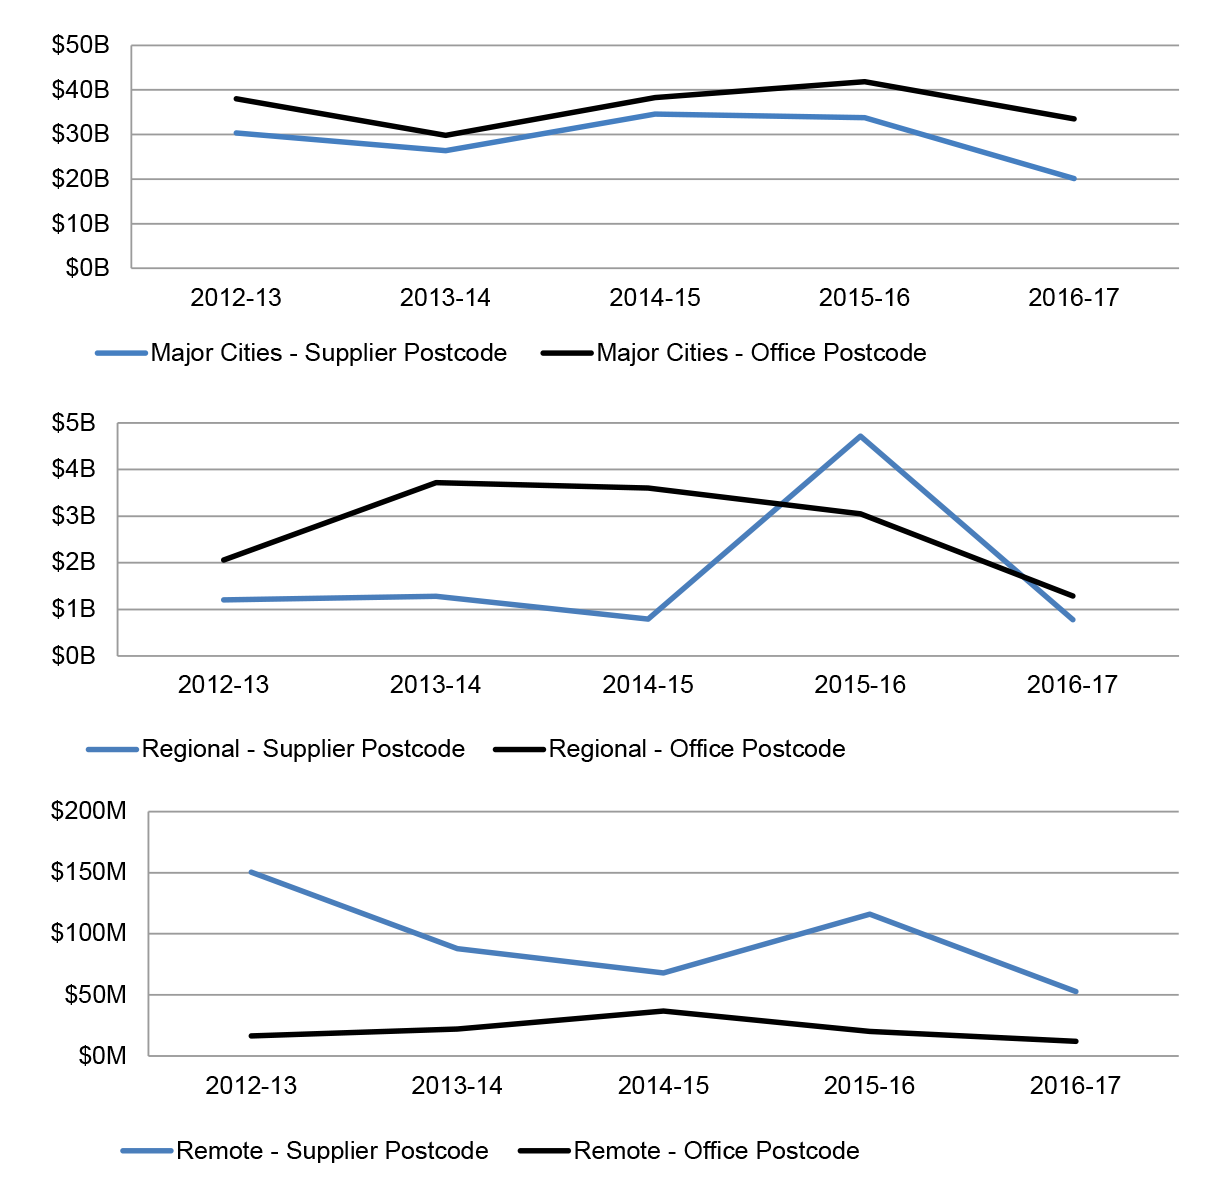
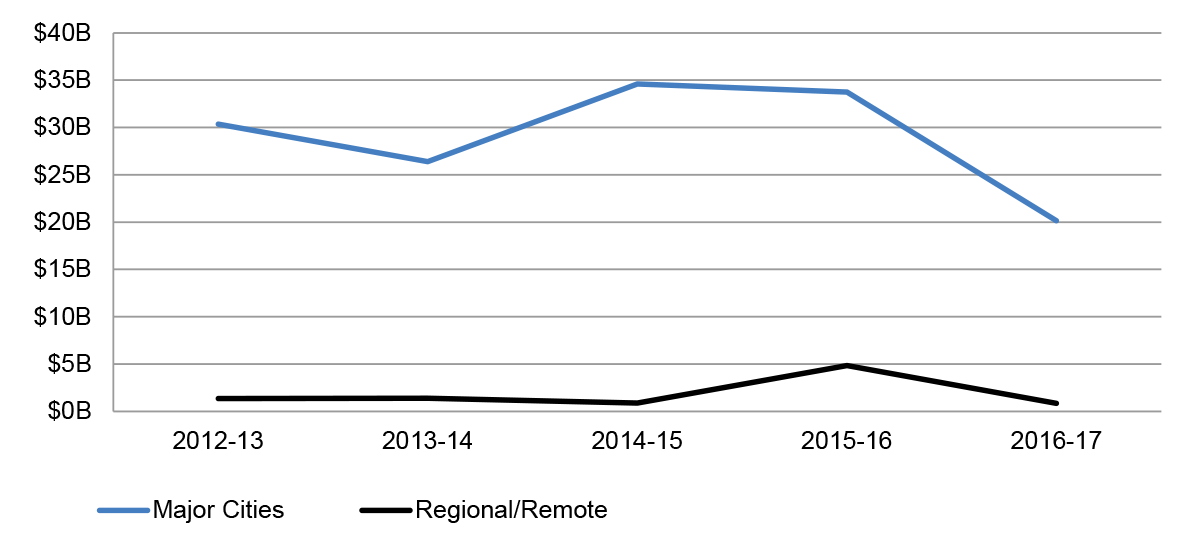
9.1 ANAO matched the AusTender Contract Notice data with remoteness data published by the Australian Bureau of Statistics using the office and supplier postcodes. The following analysis classifies procurement by Major City, Regional, and Remote areas.49
Figure 9.1: Contract value by supplier remoteness and office remoteness by financial year (2012–13 to 2015–16)
Source: ANAO analysis of AusTender data.
Figure 9.2: Contract value by supplier remoteness and financial year (2012–13 to 2016–17)50
Source: ANAO analysis of AusTender data.
Figure 9.3: Contract value by supplier state and financial year (2012–13 to 2016–17)51
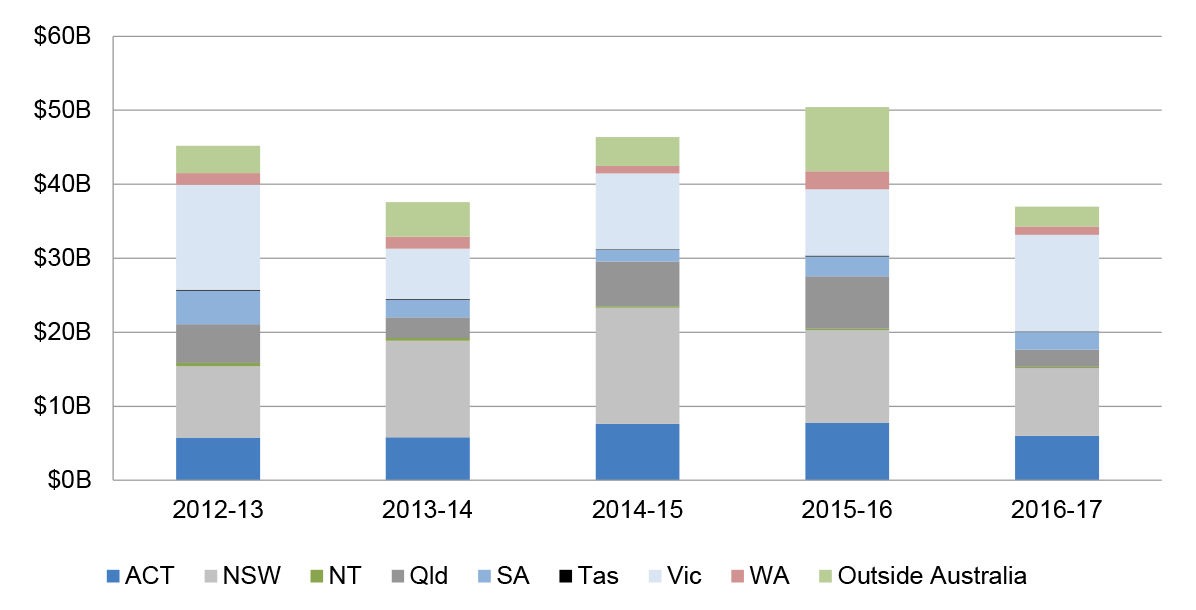
Source: ANAO analysis of AusTender data,
10. Procurement methods
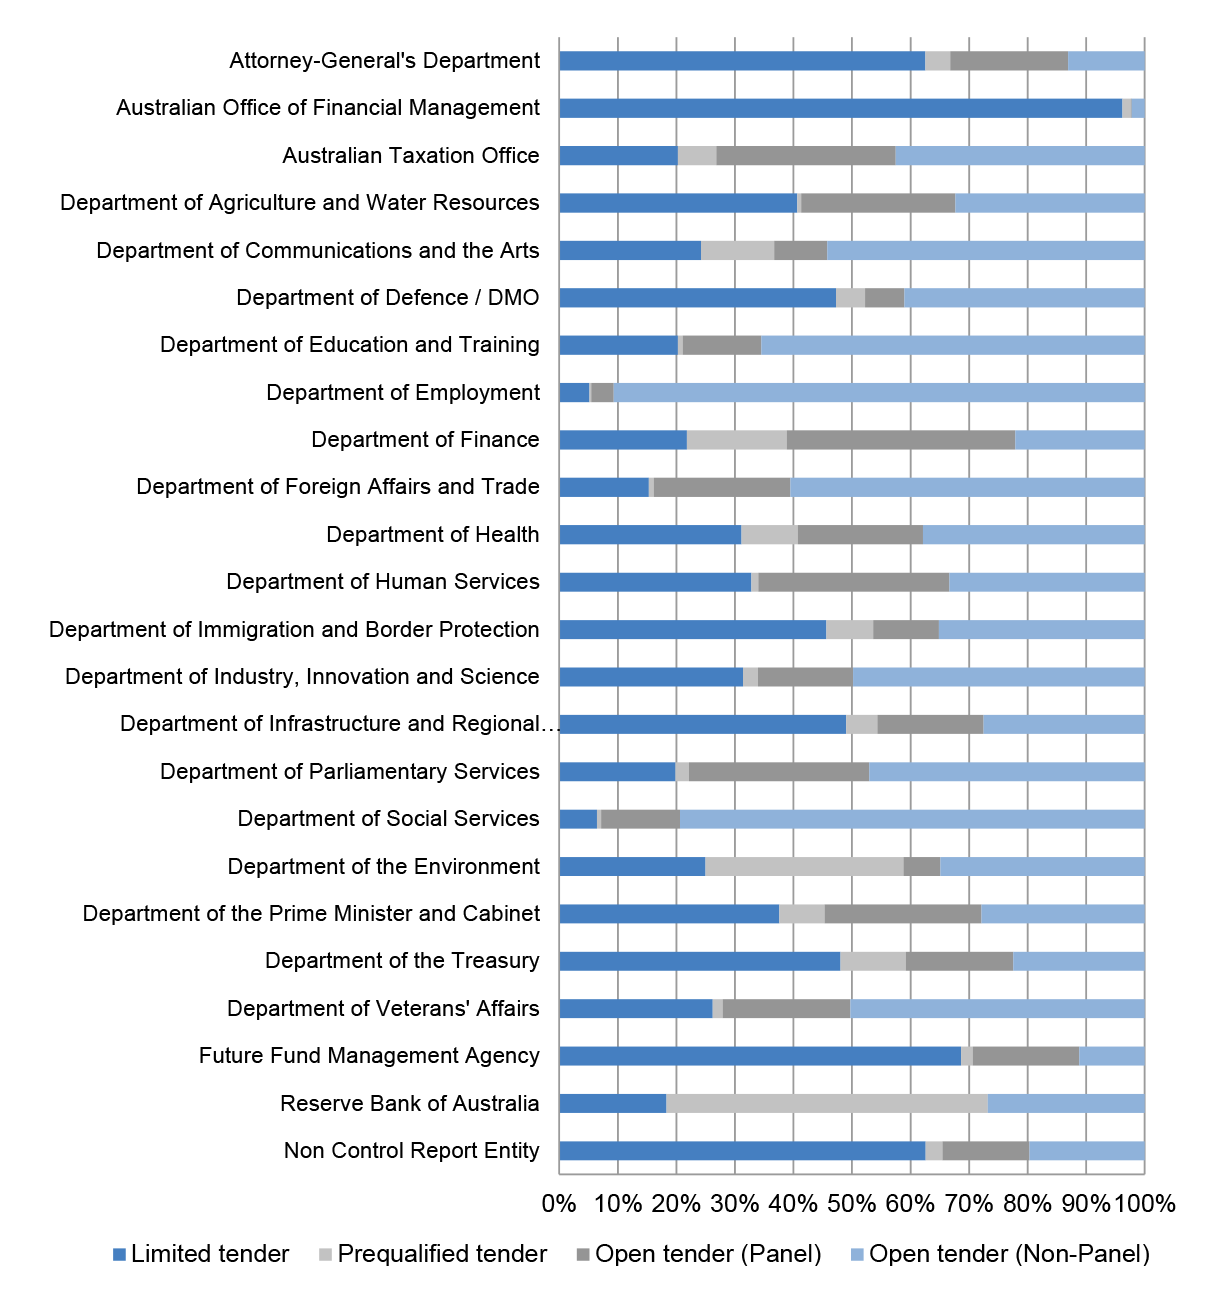
10.1 Entities are required to report contracts against three methods of procurement; Limited Tender, Open Tender, or Prequalified tender. The analysis in this chapter shows use of procurement method across the Commonwealth and by entity.
Figure 10.1: Contract value by procurement method and financial year (2012–13 to 2016–17)
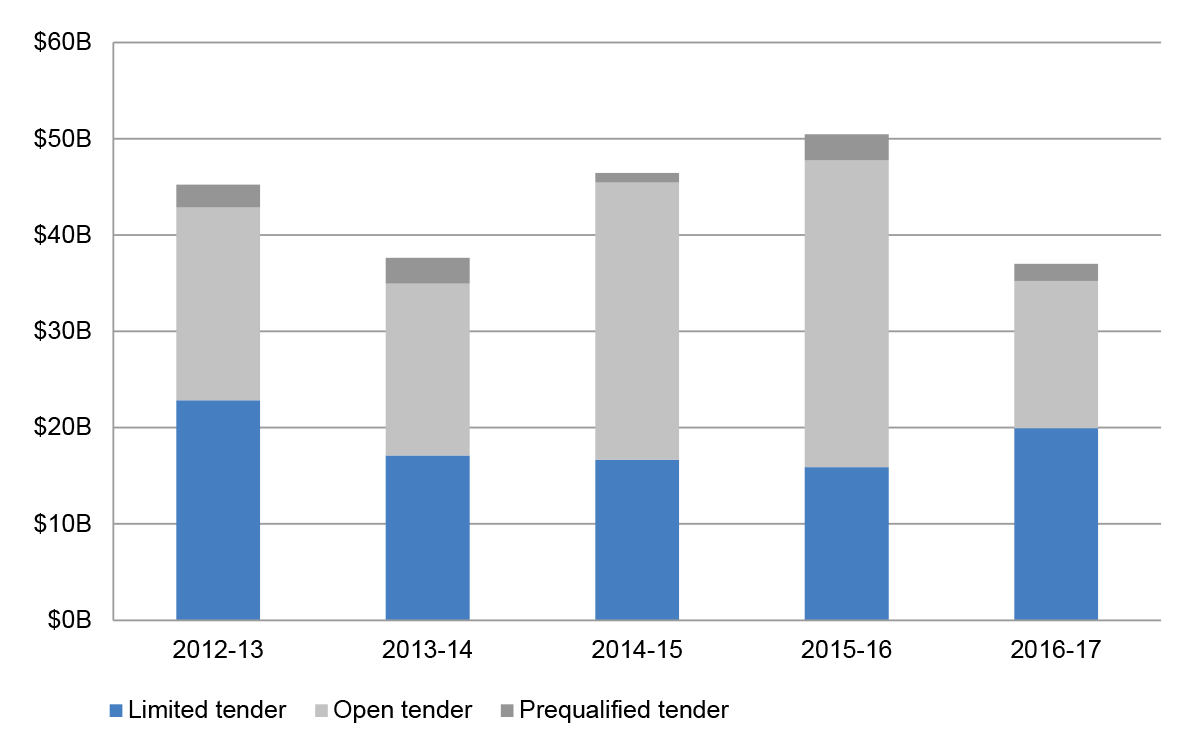
Source: ANAO analysis of AusTender data.
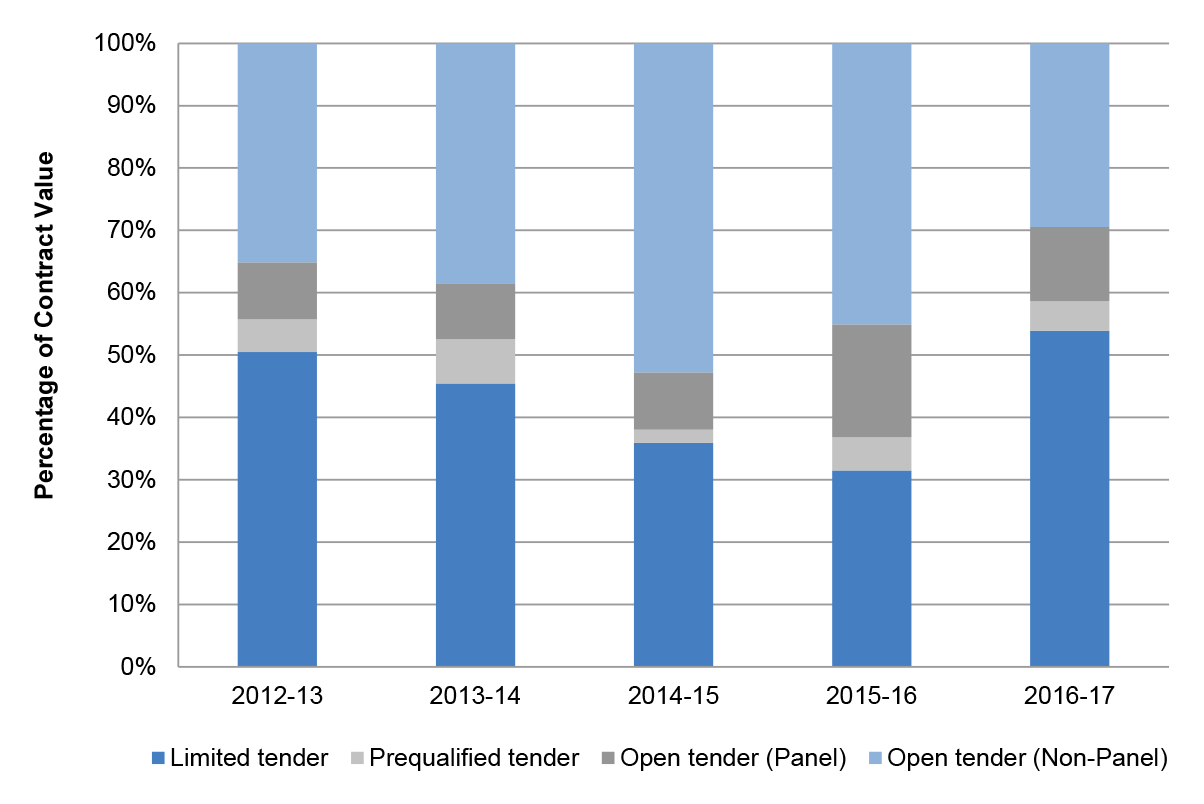
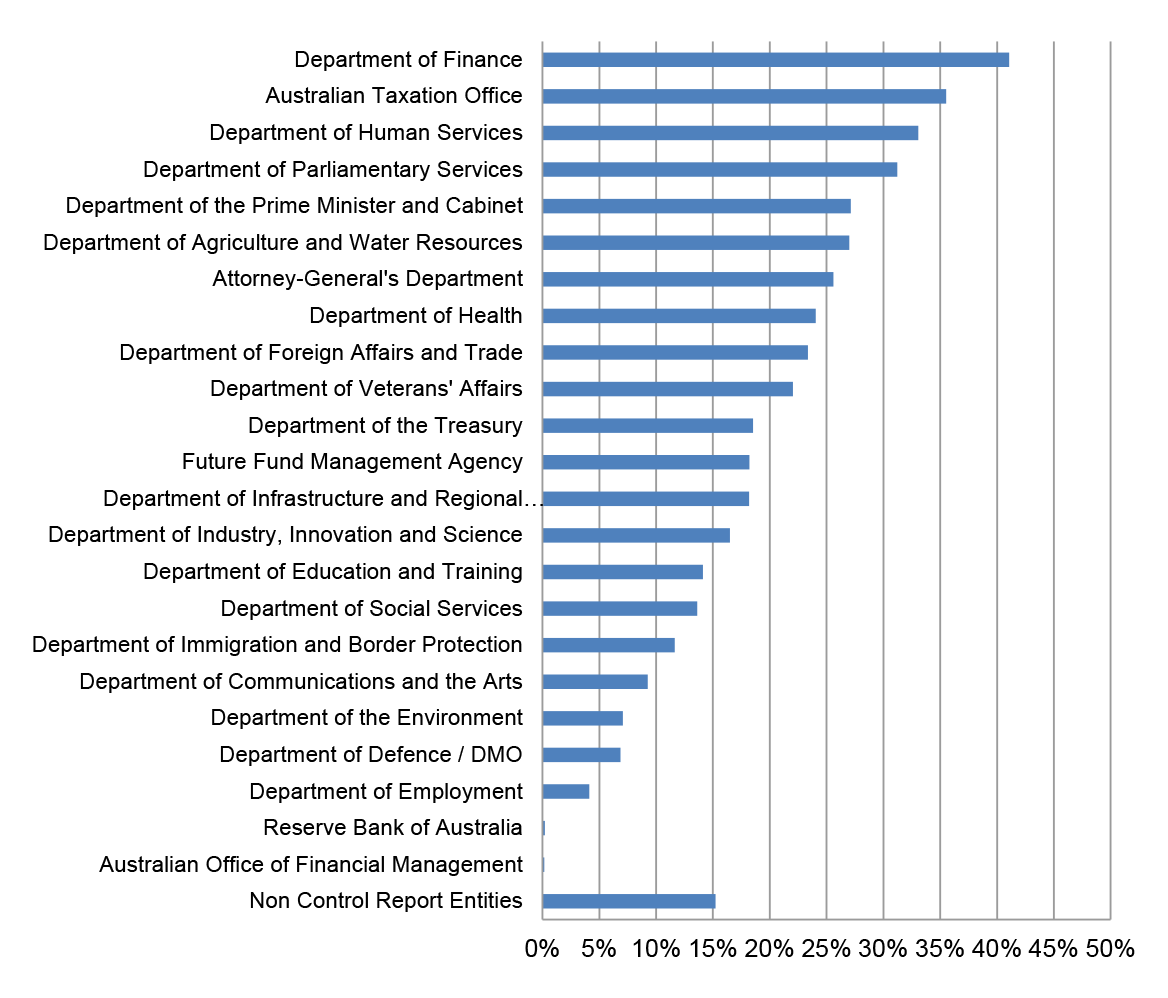
10.2 Entities are also required to identify when publishing contracts whether the procurement was conducted from a panel arrangement. Figure 10.2 shows the percentage of contract value by procurement method including for Open Tender contracts, whether the procurement was flagged as having a panel arrangement.52
10.3 In addition to open approaches to market, contract notices may be categorised as 'open tender' where the supplier has been sourced from a panel arrangement that was established through a procurement process (either open tender or prequalified tender). Procurement can then be undertaken with any supplier on the panel.53
10.4 Contracts with procurement methods other than Open Tender may also be flagged as using a panel arrangement however the percentages are small and have not been shown separately on this chart.54
Figure 10.2: Percentage of contract value by procurement method (including panel arrangement status for open tender contracts) and financial year (2012–13 to 2016–17)
Source: ANAO analysis of AusTender data.
Figure 10.3: Value of contracts using panel arrangements as a percentage of all contracts by financial year (2012–13 to 2016–17)55
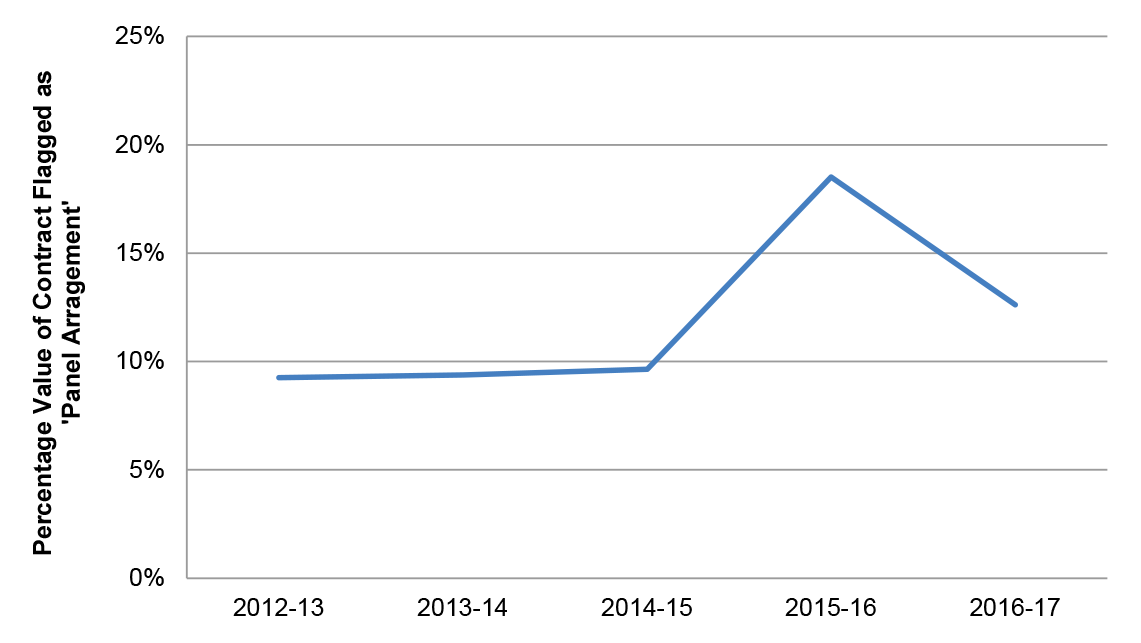
Source: ANAO analysis of AusTender data.
Figure 10.4: Percentage of contract value by procurement method by entity56 (2012–13 to 2016–17)
Source: ANAO analysis of AusTender data.
Figure 10.5: Value of contracts using panel arrangements as a percentage of entities total contract value (2012–13 to 2016–17)57
Source: ANAO analysis of AusTender data.
11. Concentration of suppliers (use of panels)
11.1 Procurement panels are a tool for the procurement of goods or services regularly acquired by entities. Panels are established through procurement processes, where a number of suppliers are appointed through a contract or deed of standing offer. Panels are usually established at a point in time, and once established, the opportunity for other suppliers to join the panel will generally be limited.58
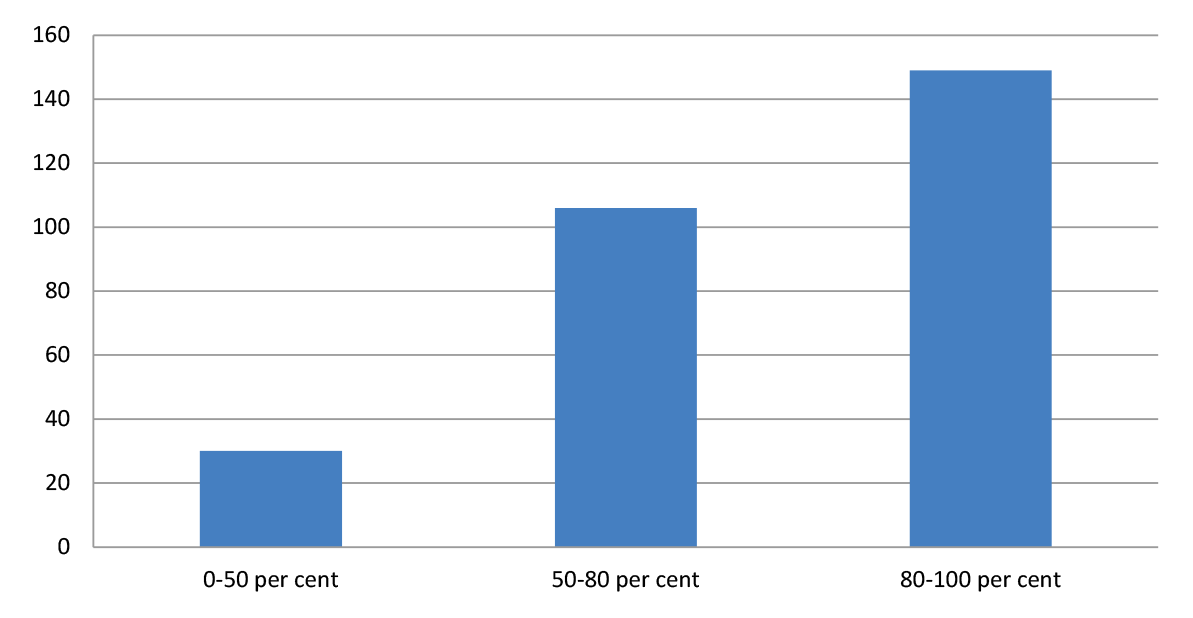
11.2 The ANAO analysed procurements from 285 procurement panels59 that contained contracts between and Financial Year 2012–13 and 2016–17. The ANAO examined panels with five or more suppliers, to identify a 'top 20 per cent'—the top 20 per cent of suppliers by value of contracts awarded.60 The ANAO then analysed the proportion of contracts (by value) that were awarded to these 'top 20 per cent' suppliers.
11.3 Table 11.1 and Figure 11.1 show the value of procurements undertaken by the 'top 20 per cent' of firms on each of the panels included in the analysis.
Table 11.1: Panels by the percentage of contract value awarded to the 'top 20 per cent' of suppliers
|
Percentage of contract value by top 20 per cent of suppliers |
Number of panels |
Contract value awarded to the top 20 per cent of suppliers ($000's) |
Total contract value of panels ($000's) |
Notes |
|
>80 per cent |
149 |
11,281,891 |
12,427,074 |
The large majority of panels examined had a relatively small proportion of suppliers awarded the majority of contract value. There were a relatively small number of successful suppliers on these panels. |
|
50–80 per cent |
106 |
3,726,508 |
5,506,220 |
|
|
0–50 per cent |
30 |
163,503 |
423,611 |
Generally, these panels saw more even distribution of procurements among successful suppliers |
Source: ANAO analysis of AusTender data.
Figure 11.1: Number of panels by the percentage of contract value awarded to the 'top 20 per cent' of suppliers (2012–13 to 2016–17)
Source: ANAO analysis of AusTender data.
12. Small and medium enterprises
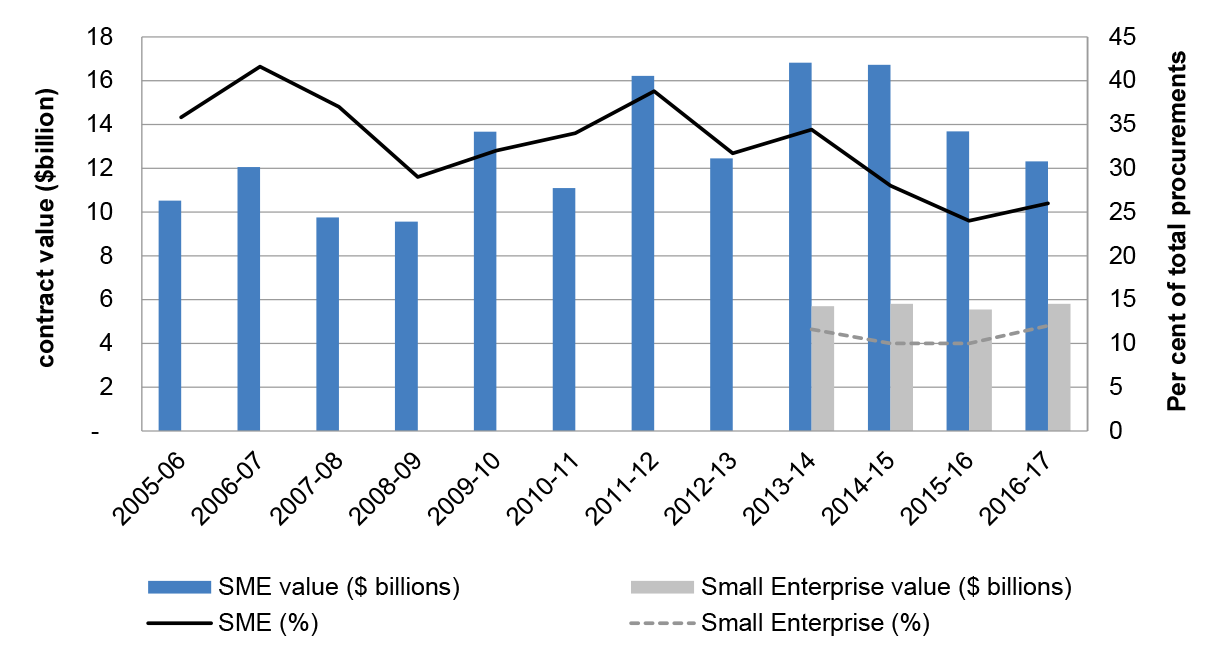
12.1 The CPRs set a target of at least 10 per cent (by value) of procurements from Small to Medium Enterprises (SMEs) by non-corporate Commonwealth entities. The Department of Finance (Finance) reports against this target, and the proportion of procurement contracts by number and value to small businesses. Figure 12.1 shows Finance's reporting of the value and percentage of procurements undertaken with SMEs since 2005–06; and from 2013–14, the value and percentage of procurements undertaken with small enterprises.61
12.2 Since reporting began, Finance has published a result between 24 and 42 per cent, well above the Government target.
Figure 12.1: SME and Small Enterprises participation
Source: Department of Finance, reported Finance data, Statistics on Australian Government Procurement Contracts. available from <https://www.finance.gov.au/procurement/statistics-on-commonwealth-purchasing-contracts> [accessed 7 December 2016].
12.3 An SME is defined as a business which has fewer than 200 employees and operates independently of any parent organisation for taxation arrangements. A small business is defined as a business with fewer than 20 employees.62
12.4 Finance contracts the analysis of Government procurement from SMEs to the Australian Bureau of Statistics (ABS). Aggregated results by entity and the number of businesses in each category (SME or Other63) are published by Finance but the individual classification of suppliers as either SME or other is not released publically. The latest Finance publication of procurement statistics was released in November 2017 for the 2016–17 financial year.
Table 12.1: Entities with a reported percentage of contract value with SMEs greater than 85 per cent (2016–17)
|
Entity |
Reported percentage of contract value with SMEs (per cent) |
|
Office of the Australian Information Commissioner |
96 |
|
Royal Australian Mint |
94 |
|
Administrative Appeals Tribunal |
93 |
|
Clean Energy Regulator |
92 |
|
National Capital Authority |
92 |
|
Department of Foreign Affairs and Trade – Australian Aid Program |
91 |
|
Australian National Audit Office (ANAO) |
90 |
|
Old Parliament House |
90 |
|
National Health Funding Body |
87 |
|
National Mental Health Commission |
86 |
Source: Department of Finance, Subset of reported Finance data, Statistics on Australian Government Procurement Contracts, available from <https://www.finance.gov.au/procurement/statistics-on-commonwealth-purchasing-contracts>.
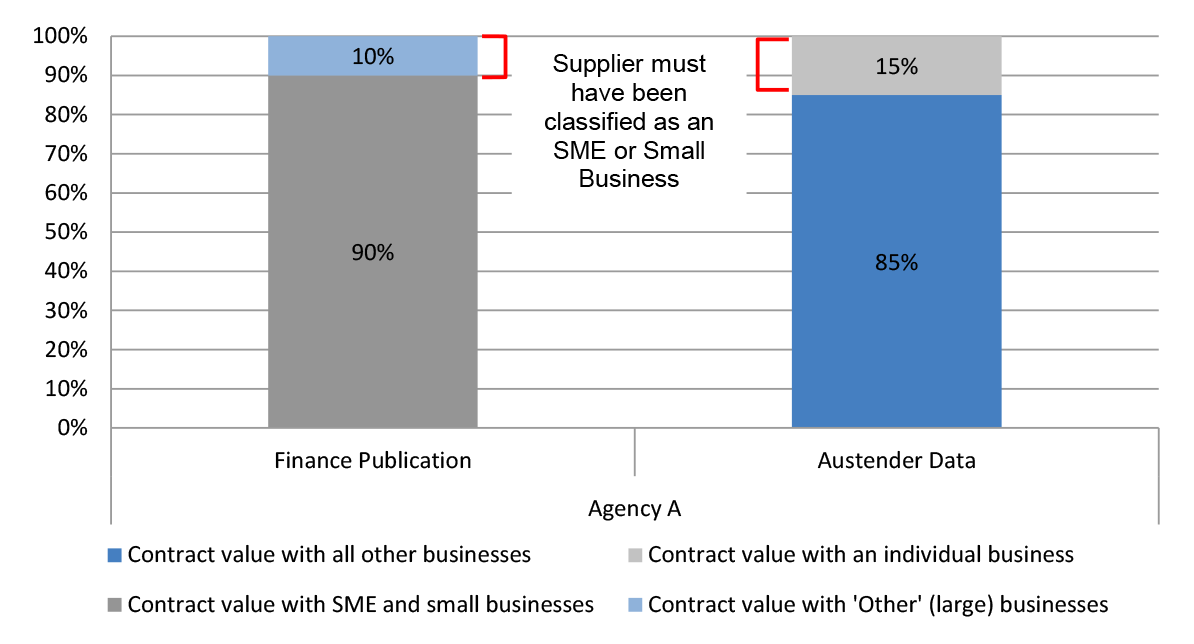
12.5 The absence of information regarding classification of suppliers as either SME or 'Other' (large) prevents an in-depth analysis of procurement with SMEs. However, the ANAO examined a selection of entities with a reported high proportion of SME contract value.64 In particular, the ANAO examined entities where:
- Finance reported a very high percentage (by value) of procurements awarded to SMEs; and
- the percentage of the value of contracts awarded to individual businesses by an entity was greater than the percentage of procurement Finance reported as belonging to 'Other' (large) businesses by that entity.
12.6 In the circumstance described above, that business would (by definition) have been classified as a small enterprise or SME.
|
Box 1: Illustration example—Identifying SMEs from entity level results |
|
Figure 12.2: Illustration example—Identifying SMEs from entity level results
12.7 Using this methodology, ANAO identified a number of businesses with large numbers and values of contracts in 2016–17 that appeared to have been classified as SMEs. These included major consultancy/accountancy firms and other Australian arms of large global business with thousands of employees.
12.8 Table 12.2 lists these suppliers with the entity that was used to identify them as a likely SME and the value of contracts for that supplier with that entity in 2016–17.
Table 12.2: Selection of suppliers classified as small or SME and contract value (2016–17)
|
Suppliers classified as small or SME |
Entity for which data was used to identify supplier as an SME |
Value of supplier contracts with respective entity ($000's) |
|
Abt JTA |
Department of Foreign Affairs and Trade – Australian Aid Program |
194,199 |
|
Charter Hall Real Estate Management Services |
Australian Prudential Regulation Authority (APRA) |
105,402 |
|
Cardno |
Department of Foreign Affairs and Trade – Australian Aid Program |
81,207 |
|
Coffee international Development |
Department of Foreign Affairs and Trade – Australian Aid Program |
57,193 |
|
Baxalta Australia |
National Blood Authority |
47,219 |
|
Seco Tools Australia |
Royal Australian Mint |
23,179 |
|
Sliced Tech |
National Capital Authority |
3,426 |
|
Dixon Appointments |
Tertiary Education Quality and Standards Agency |
3,239 |
|
ActewAGL |
National Capital Authority |
3,229 |
|
Design Craft Furniture |
Department of the Senate |
2,828 |
|
Connetica Consulting |
National Mental Health Commission |
847 |
|
PwC |
National Health Funding Body |
636 |
|
Holding Redlich |
Office of the Australian Information Commissioner |
401 |
|
Ernst & Young |
National Health Funding Body |
399 |
|
Nous Group |
National Mental Health Commission |
380 |
Source: ANAO Analysis of AusTender data.
|
Suppliers classified as small or SME |
Entity for which data was used to identify supplier as an SME |
Value of supplier contracts with respective entity ($000's) |
|
Abt JTA |
Department of Foreign Affairs and Trade – Australian Aid Program |
194,199 |
|
Charter Hall Real Estate Management Services |
Australian Prudential Regulation Authority (APRA) |
105,402 |
|
Cardno |
Department of Foreign Affairs and Trade – Australian Aid Program |
81,207 |
|
Coffee international Development |
Department of Foreign Affairs and Trade – Australian Aid Program |
57,193 |
|
Baxalta Australia |
National Blood Authority |
47,219 |
|
Seco Tools Australia |
Royal Australian Mint |
23,179 |
|
Sliced Tech |
National Capital Authority |
3,426 |
|
Dixon Appointments |
Tertiary Education Quality and Standards Agency |
3,239 |
|
ActewAGL |
National Capital Authority |
3,229 |
|
Design Craft Furniture |
Department of the Senate |
2,828 |
|
Connetica Consulting |
National Mental Health Commission |
847 |
|
PwC |
National Health Funding Body |
636 |
|
Holding Redlich |
Office of the Australian Information Commissioner |
401 |
|
Ernst & Young |
National Health Funding Body |
399 |
|
Nous Group |
National Mental Health Commission |
380 |
Source: ANAO Analysis of AusTender data.
12.9 The ANAO provided ABS with the results of this analysis. The ABS advised it has revised its methodology relating to 'the classification of large businesses operating under multiple ABNs and the potential for these businesses to be incorrectly classified as Small to Medium Enterprises'.
13. Procurement contract confidentiality provisions
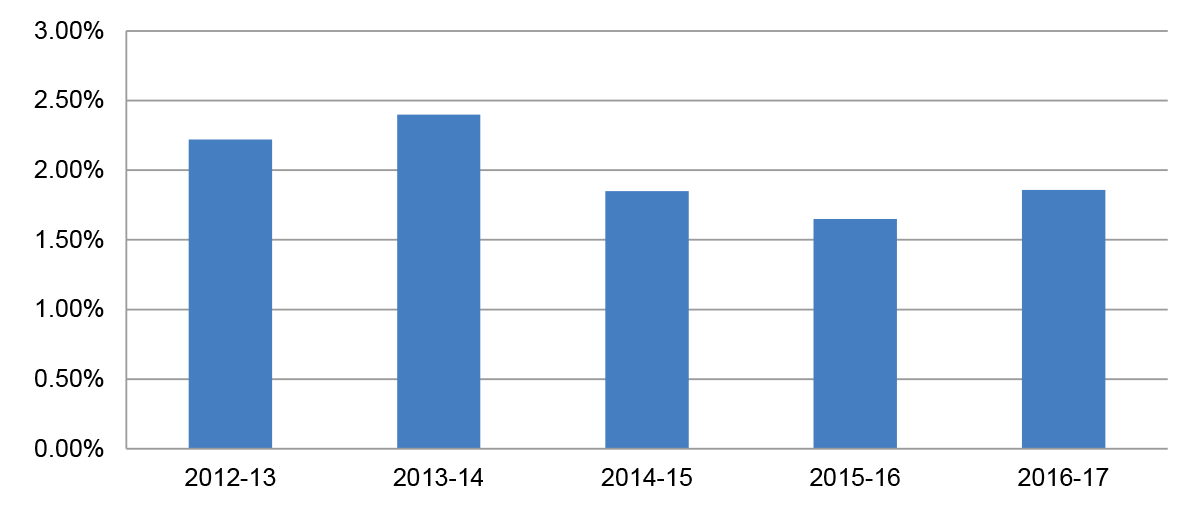
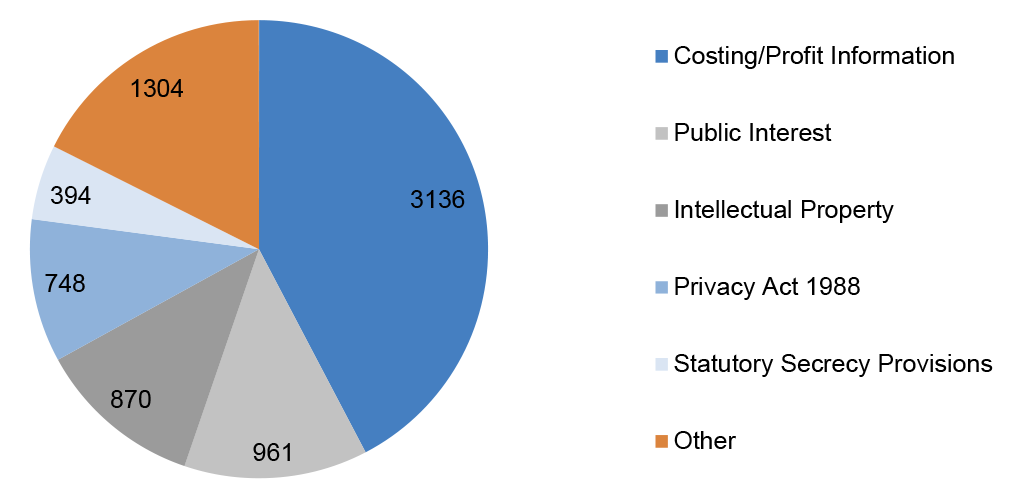
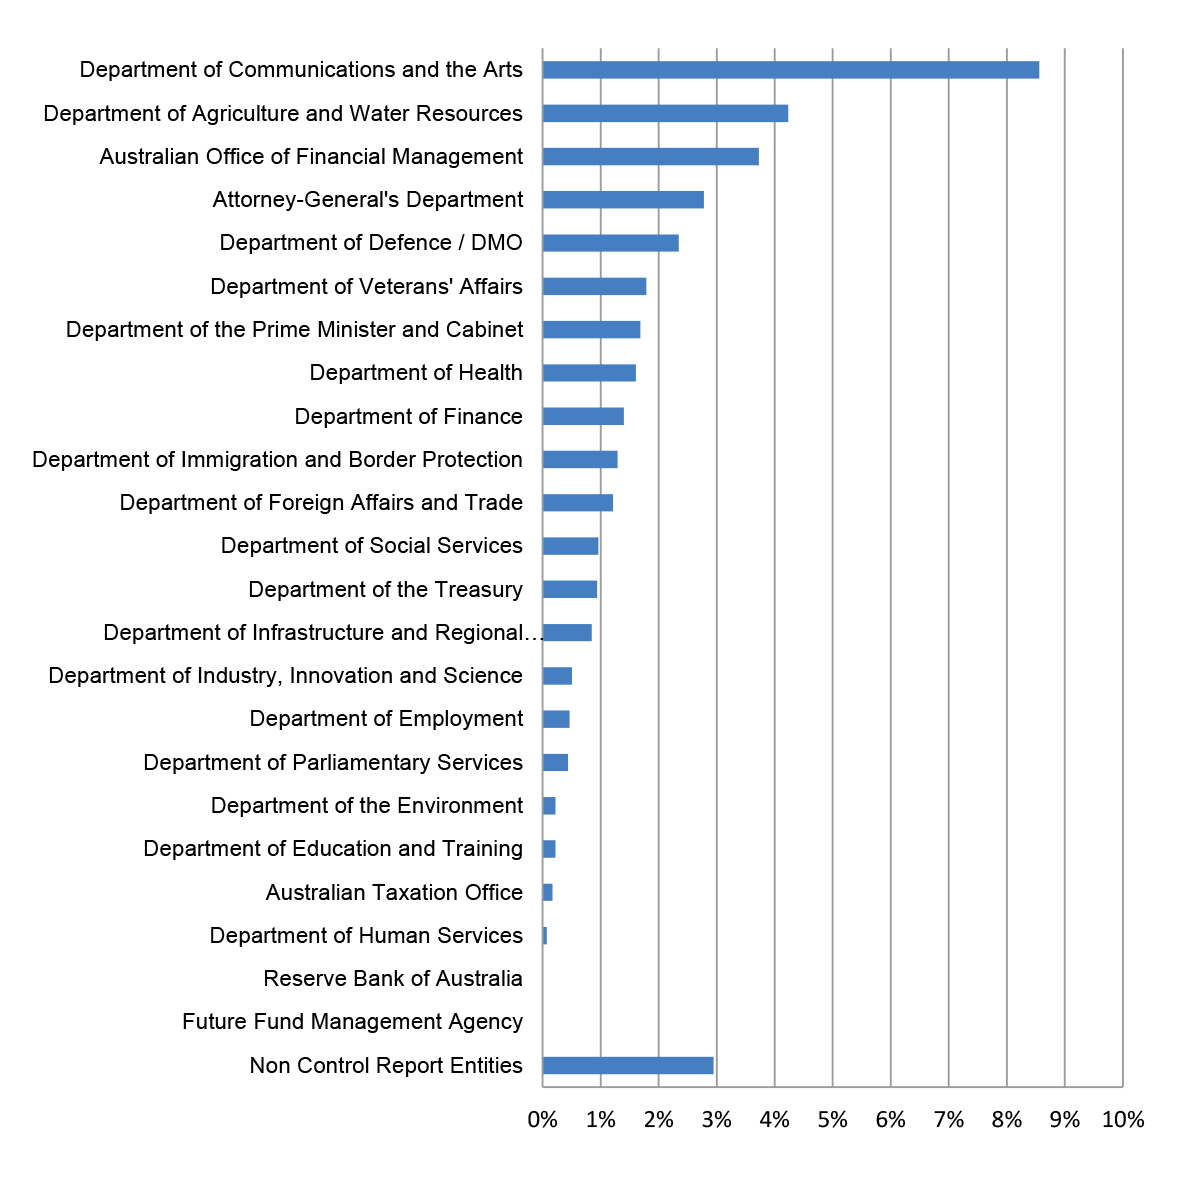
13.1 Contracts published on AusTender are required to identify if the contract includes a confidentially provision. The reasons for confidentially should also be recorded.65
Figure 13.1: Proportion of contracts with confidentiality provisions by financial year (2012–13 to 2016–17)
Source: ANAO Analysis of AusTender data.
Figure 13.2: Reasons for contract confidentially66 2012–13 to 2016–17
Source: ANAO Analysis of AusTender data.
Figure 13.3: Percentage of contracts with confidentialy provisions by entity (2012–13 to 2016–17)
Source: ANAO Analysis of AusTender data.
14. Contract amendments
14.1 The publically available contract notice data lists the latest information relevant to each contract, but does not provide historical data on contract amendments. In order to conduct a more detailed analysis of contract amendments, the ANAO has used data from weekly export files that Finance publish on AusTender.67 These files are only provided for the most recent 18 months and include fields showing the 'Parent' (or previous) Contract Notice ID and the 'Amendment Publish Date'.
14.2 At the time of publishing this report, ANAO had access to two years of these weekly export files containing contracts published or amended between 8 November 2015 and 6 November 2017.
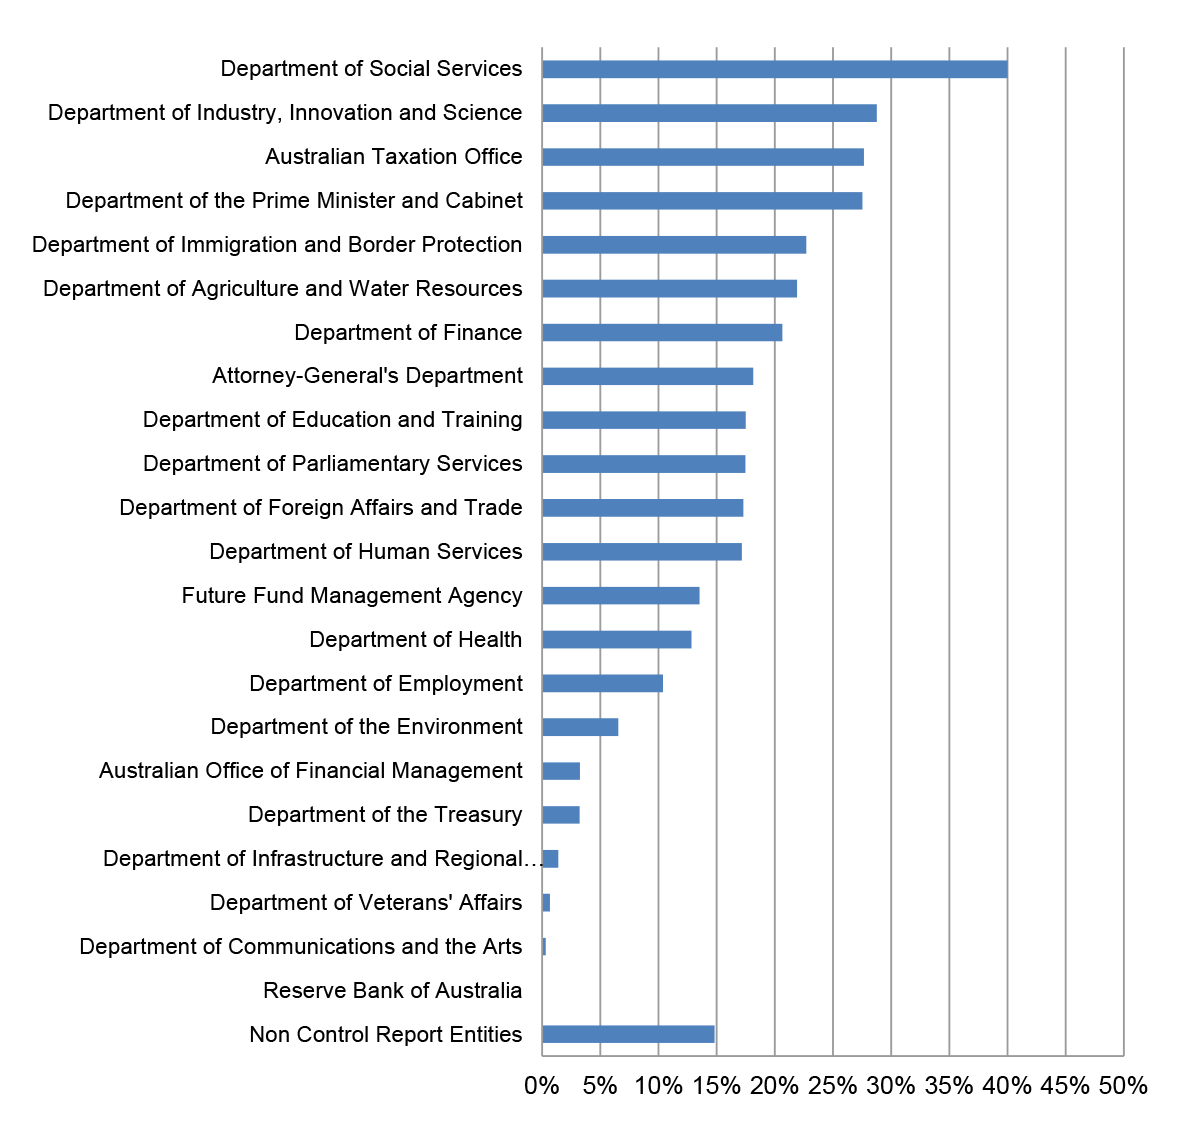
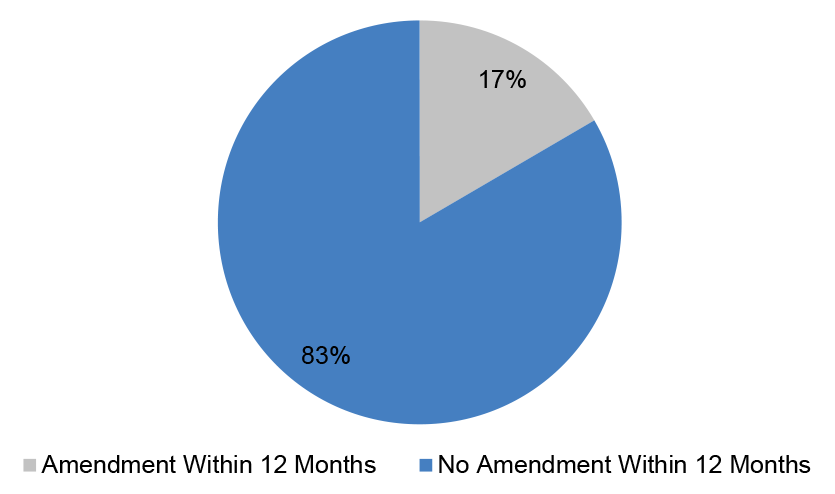
14.3 Figure 14.1 and Figure 14.2 show the percentage of contracts originally published in the first year of the data range (8 November 2015 to 7 November 2016) that were amended within 12 months of the contracts original publication date.
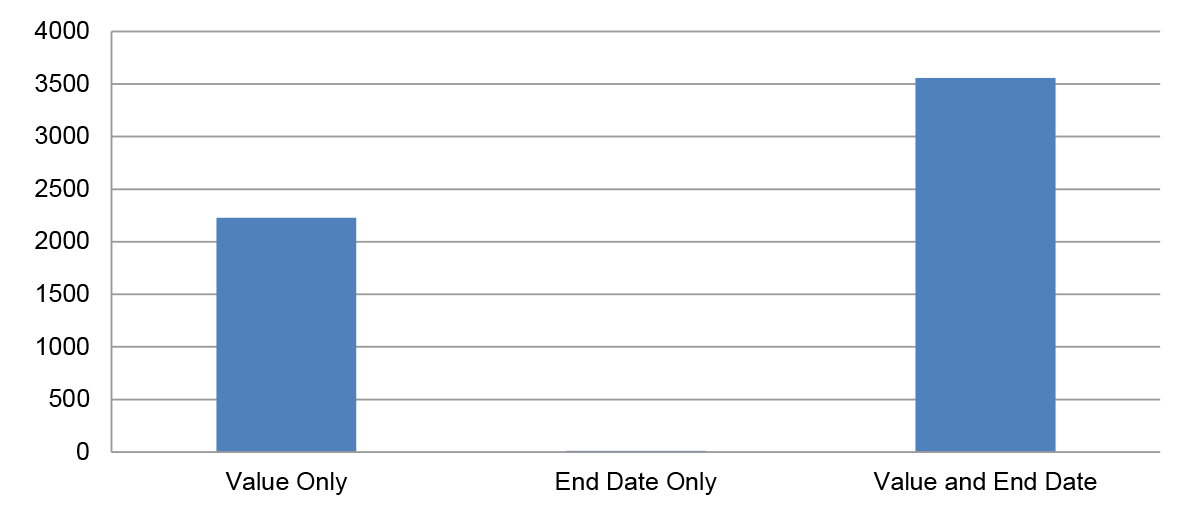
14.4 For the purposes of this analysis, ANAO only considered contracts to be amended if the contract value or end date had been changed after the contract was originally published.68
14.5 The Department of Defence / Defence Materiel Organisation have been excluded from this analysis as they do not record contract amendments using the 'Parent CN ID' or 'Amendment Publish Date' fields provided in AusTender.
Figure 14.1: Percentage of contracts amended within 12 months of contracts original publish date by entity – Contracts with an original publish date from 8 November 2015 to 7 November 2016
Source: ANAO Analysis of AusTender data.
Figure 14.2: Percentage of contracts amended within 12 months of contracts original publish date – Contracts with an original publish date from 8 November 2015 to 7 November 2016 – excluding Department of Defence / DMO
Source: ANAO Analysis of AusTender data.
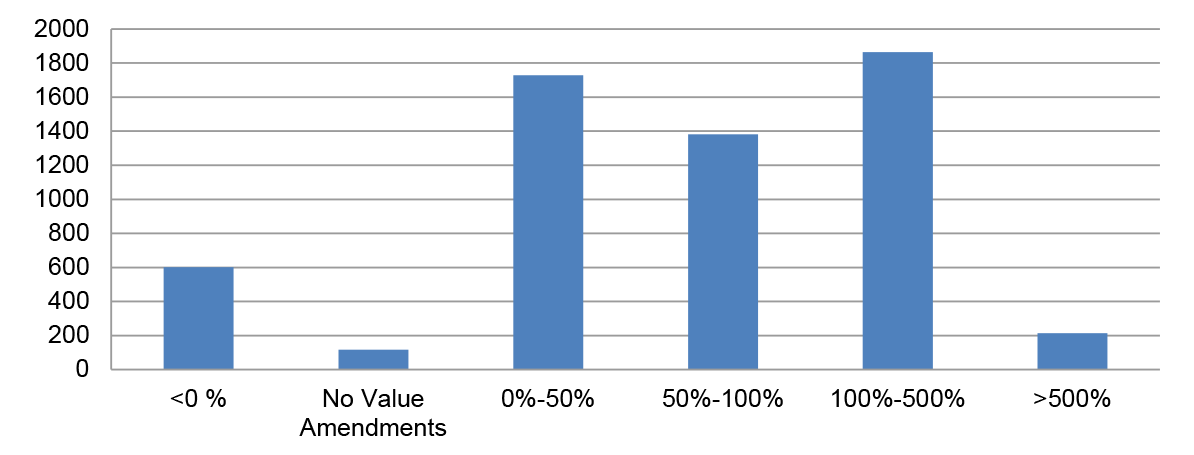
14.6 The following analysis looks at only those contracts that were amended within 12 months of the contracts original publish date.
Figure 14.3: Number of contracts amended within 12 months of contracts original publish date – field/s amended69
Source: ANAO Analysis of AusTender data.
Figure 14.4: Contracts amended within 12 months of original publish date – percentage change in contract value
Source: ANAO Analysis of AusTender data.
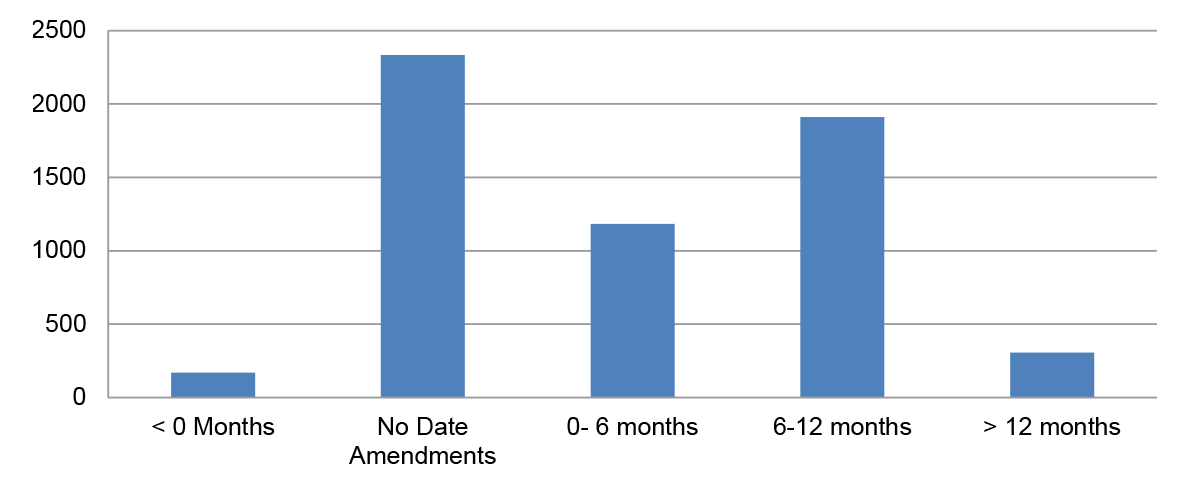
Figure 14.5: Contracts amended within 12 months of original publish date – changes to contract end dates
Source: ANAO Analysis of AusTender data.
Appendices
Appendix 1 Methodology
1. All analysis in this report has been conducted using publically available data. The majority of analysis was conducted using AusTender contract notice data.70 This data shows contract information published on AusTender as at 11 September 2017.71 Contracts may have been added, amended or removed since this date. This dataset reflects reported contractual information and does not necessarily represent actual expenditure.
2. Where required, the ANAO has also used data from other available datasets and reports. Specifically, Standing Offer Notice data available from AusTender, remoteness data from the Australian Bureau of Statistics, and other publications by the Department of Finance.
3. Where possible, historical analysis has been conducted for five financial years from 2012–13 through to 2016–17. Where the data was unsuitable or unavailable for analysis across this period, a smaller date range has been used. Examples of this include:
- excluding 2016–17 data for analysis of the time taken to publish contracts on AusTender; and
- amendment analysis using a two year period of weekly export files rather than the historical data set which does not show a history of amendments.
4. Unless otherwise specified ANAO has used the contract ‘Start Date’ rather than the ‘Publish Date’ to determine the financial year of the contract. This aims to better reflect the period procurement commitments were made as the Commonwealth Procurement Rules only require entities to report (or publish) their contracts to AusTender within 42 days of entering (or amending) the contract.
5. AusTender data generally shows the only the latest details of a contract. I.e. if a contract has been updated or amended in a subsequent financial year (including changes to value), those figures will be reported against the financial year of the contract’s listed ‘Start Date’ and not when the contract was amended.
6. In order to address identified issues with consistency arising from some entities regularly reporting amendments to (or purchase orders for) existing contracts against new Contract Notice IDs, unless otherwise specified, ANAO has used the AusTender field ‘Agency Reference ID’ to assist in aggregating these records into a single contract when performing analysis. These contracts will have their values and details reported against the period when the earliest contract commenced.
7. This aggregation and most ANAO analysis using ‘Start Date’ rather than ‘Publish Date’ are the primary reasons why ANAO results will differ from figures reported by the Department of Finance.
8. For most analysis that list supplier names, ANAO has used a combination of ABN matching and keyword matches of supplier name details entered in AusTender to aggregate related suppliers where businesses use multiple ABNs or no ABN (in the case of ABN exempt suppliers).
9. The ANAO has also made assumptions and adjustments to the data to better reflect the Machinery of Government changes that have occurred since 1 July 2012.
10. All analysis is conducted on the latest nominal figures at the time of extract. That is, reported dollar values have not been adjusted for inflation.
11. AusTender uses a subset of the United Nations Standard Products and Services Code (UNSPSC) to categorise Commonwealth Government procurements. In this report, ANAO has used this code-set created by Finance with one modification. That is combining the categories of ‘Information Technology Broadcasting and Telecommunications’ and ‘Engineering and Research and Technology Based Services’.
Footnotes
1 Figure published by Department of Finance based on the value of contracts reported (published) in 2016–17
https://www.finance.gov.au/procurement/statistics-on-commonwealth-purchasing-contracts/
2 Officials from non-corporate Commonwealth entities and prescribed corporate Commonwealth entities listed in section 30 of the Public Governance, Performance and Accountability Rule 2014 must comply with the CPRs when performing duties related to procurement.
3 The reporting thresholds (including GST) are: $10,000 for non-corporate Commonwealth entities; and for prescribed corporate Commonwealth entities, $400,000 for procurements other than construction services, or $7.5 million for construction services.
4 Figure published by Department of Finance based on the value of contracts reported (published) in 2016–17 https://www.finance.gov.au/procurement/statistics-on-commonwealth-purchasing-contracts/
5 ANAO recommended entities improve AusTender accuracy in the following audits:
- ANAO Audit Report No.4 2015–16 Confidentiality in Government Contracts: Senate Order for Entity Contracts (Calendar Year 2014 Compliance), Recommendation 3, Para. 4.17.
- ANAO Audit Report No.48 2014–15 Limited Tender Procurement, Recommendation 2, Para. 3.18.
ANAO discussed AusTender data quality in the following audits:
- ANAO Audit Report No.18 2016–17 Confidentiality in Government Contracts: Senate Order for Entity Contracts (Calendar Year 2015 Compliance), Para. 5 and 2.18.
- ANAO Audit Report No.31 2011–12 Establishment and Use of Procurement Panels, Para. 4.50.
- ANAO Audit Report No.11 2010–11 Direct Source Procurement, Chapter 3.
6 ANAO Audit Report No.48 2014–15 Limited Tender Procurement, p. 19 and p. 56.
7 ANAO has used the AusTender fields, ‘Agency’, ‘Agency Reference ID’, and ‘Supplier ABN’ (or ‘Supplier Name’) to aggregate related contracts.
8 Selection of entities is based on the 25 entities used in the ANAO’s ‘Interim Report on Key Financial Controls of Major Entities’. These include 19 Departments of State and four other material entities. The remaining two are Public Non-financial Corporations (NBN and AusPost) which are not included as they are not required to comply with the CPRs (including reporting contracts via AusTender). Contracts for all other entities (including Commonwealth of Australia contracts for Whole-of Government Air Travel and Car Rental estimates) have been grouped into the category ‘Non Control Report Entities’.
9 See Footnote 8 for information on selelction of entities.
10 AusTender uses a subset of the United Nations Standard Products and Services Code (UNSPSC) to categorise Commonwealth Government procurements. <http://data.gov.au/dataset/historical-australian-government-contract-data/resource/16351d2d-0f24-49ef-8add-7558116a0fa1>.
11 In this report, ANAO has combined the categories of ‘Information Technology Broadcasting and Telecommunications’ and ‘Engineering and Research and Technology Based Services’.
12 Other includes all other categories of contracts.
13 ANAO has combined the categories of ‘Information Technology Broadcasting and Telecommunications’ and ‘Engineering and Research and Technology Based Services’.
14 Other includes all other categories of contracts.
15 Significant year-by-year increases in the categories are impacted by high value, long-term contracts commencing in the respective financial years. Examples include: Telecommunications – Telecommunications Universal Service Management Agency $6.4 billion 20-year Telstra Contract for Universal Service Obligations (12-13) | Building and Construction and Maintenance Services – Department of Defence $3.9 billion for two 7-year contracts for estate maintenance (14-15) | Politics and Civil Affairs – Department of Social Services 5-year contracts with multiple Work for the Dole providers (15-16) | Healthcare – National Blood Authority $8.8 billion 10-year contract with Red Cross for blood services (16-17).
16 This analysis is based on the current contract values at the time the data was extracted, against the financial year that the contract commenced. As such, contracts reported in recent years are likely disproportionally understated due to a shorter period of time for additional purchase orders or contract amendments (usually increasing the value) compared with those contracts reported in earlier years.
17 Significant year-by-year increases in the categories are impacted by high value, long-term contracts commencing in the respective financial years. Examples include: Telecommunications – Telecommunications Universal Service Management Agency $6.4 billion 20-year Telstra Contract for Universal Service Obligations (12–13); Building and Construction and Maintenance Services – Department of Defence $3.9 billion for two 7-year contracts for estate maintenance (14–15); Politics and Civil Affairs – Department of Social Services 5-year contracts with multiple Work for the Dole providers (15–16); Healthcare – National Blood Authority $8.8 billion 10-year contract with Red Cross for blood services (16-17).
18 AusTender uses a subset of the United Nations Standard Products and Services Code (UNSPSC) to categorise Commonwealth Government procurements <http://data.gov.au/dataset/historical-australian-government-contract-data/resource/16351d2d-0f24-49ef-8add-7558116a0fa1>.
19 The 2012–13 $6.4 billion 20-year contract with Telstra for Universal Service Obligations has been removed from analysis in this chapter to better reflect overall IT procurement contract values.
20 This analysis is based on the current contract values at the time the data was extracted, against the financial year that the contract commenced. As such, contracts reported in recent years are likely disproportionally understated due to a shorter period of time for additional purchase orders or contract amendments (usually increasing the value) compared with those contracts reported in earlier years.
21 The 2012–13 $6.4 billion 20-year contract with Telstra for Universal Service Obligations has been removed from analysis in this chapter to better reflect overall IT procurement contract values.
22 The Department of Finance contract value across these categories includes substantial contracts for Whole-of Government software maintenance and support and Internet Based Network Connections Services for other Departments.
23 The 2012–13 $6.4 billion 20-year contract with Telstra for Universal Service Obligations has been removed from analysis in this chapter to better reflect overall IT procurement contract values.
24 ANAO has used a combination of ABN matching and the supplier name details entered in AusTender to aggregate related suppliers where businesses use multiple ABNs or no ABN (in the case of ABN exempt suppliers).
25 The 2012–13 $6.4 billion 20-year contract with Telstra for Universal Service Obligations has been removed from analysis in this chapter to better reflect overall IT procurement contract values.
26 Other includes all other subcategories of contracts in the IT, Telecommunications, Tech and Engineering category.
27 This analysis is based on the current contract values at the time the data was extracted, against the financial year that the contract commenced. As such, contracts reported in recent years are likely disproportionally understated due to a shorter period of time for additional purchase orders or contract amendments (usually increasing the value) compared with those contracts reported in earlier years.
28 The 2012–13 $6.4 billion 20-year contract with Telstra for Universal Service Obligations has been removed from analysis in this chapter to better reflect overall IT procurement contract values.
29 The 2012–13 $6.4 billion 20-year contract with Telstra for Universal Service Obligations has been removed from analysis in this chapter to better reflect overall IT procurement contract values.
30 <https://www.finance.gov.au/procurement/procurement-policy-and-guidance/buying/reporting-requirements/consultancies-reporting/tips.html>.
31 This analysis is based on the current contract values at the time the data was extracted, against the financial year that the contract commenced. As such, contracts reported in recent years are likely disproportionally understated due to a shorter period of time for additional purchase orders or contract amendments (usually increasing the value) compared with those contracts reported in earlier years.
32 Management advisory services, Strategic planning consultation services, Information technology consultation services, Research programs, Business intelligence consulting services and Economic or financial evaluation of projects.
Note: Legal services provided by the Australian Government Solicitor were excluded from this analysis.
33 This analysis is based on the current contract values at the time the data was extracted, against the financial year that the contract commenced. As such, contracts reported in recent years are likely disproportionally understated due to a shorter period of time for additional purchase orders or contract amendments (usually increasing the value) compared with those contracts reported in earlier years.
34 Management advisory services, Strategic planning consultation services, Information technology consultation services, Research programs, Business intelligence consulting services and Economic or financial evaluation of projects.
Note: Legal services provided by the Australian Government Solicitor were excluded from this analysis.
35 This analysis is based on the current contract values at the time the data was extracted, against the financial year that the contract commenced. As such, contracts reported in recent years are likely disproportionally understated due to a shorter period of time for additional purchase orders or contract amendments (usually increasing the value) compared with those contracts reported in earlier years.
36 ANAO has used a combination of ABN matching and the supplier name details entered in AusTender to aggregate related suppliers where businesses use multiple ABNs.
37 Australian Office of Financial Management, Future Fund Management Agency and Reserve Bank of Australia only had four, two, and two contracts respectively with ‘big four’ suppliers in this period.
38 This analysis is based on the current contract values at the time the data was extracted, against the financial year that the contract commenced. As such, contracts reported in recent years are likely disproportionally understated due to a shorter period of time for additional purchase orders or contract amendments (usually increasing the value) compared with those contracts reported in earlier years.
39 Contracts less than 31 days in length as calculated by the difference between the contract’s ‘Start Date’ and ‘End Date’ at the time of extract.
40 Control Report Entities with less than 50 short-term contracts per year have been excluded from this analysis (AOFM, Future Fund Management Agency).
41 Control Report Entities with less than 50 short-term contracts per year have been excluded from this analysis. (Australian Office of Financial Management, Reserve Bank of Australia, and Future Fund Management Agency).
42 CPRs, Para. 9.5.
43 Open tender involves publishing an open approach to market and inviting submissions. Open tender contracts can occur under panels or via an open approach to market on AusTender, in accordance with the CPRs. <https://www.finance.gov.au/sites/default/files/commonwealth-procurement-rules.pdf>.
44 The original contract is not considered as a duplicate contract in this analysis.
45 The Computer Services category is often used for the procurement of temporary IT support personnel.
46 This analysis does not include the timeliness of publication of contract amendments.
47 The reporting thresholds (including GST) are: $10,000 for non-corporate Commonwealth entities; and for prescribed corporate Commonwealth entities, $400,000 for procurements other than construction services, or $7.5 million for construction services.
48 Analysis has only been conducted up to 2015-16 as a high proportion of overdue contracts for 2016–17 would not appear in the data at the date of extract.
49 This analysis is based on the current contract values at the time the data was extracted, against the financial year that the contract commenced. As such, contracts reported in recent years are likely disproportionally understated due to a shorter period of time for additional purchase orders or contract amendments (usually increasing the value) compared with those contracts reported in earlier years.
50 This analysis is based on the current contract values at the time the data was extracted, against the financial year that the contract commenced. As such, contracts reported in recent years are likely disproportionally understated due to a shorter period of time for additional purchase orders or contract amendments (usually increasing the value) compared with those contracts reported in earlier years.
51 This analysis is based on the current contract values at the time the data was extracted, against the financial year that the contract commenced. As such, contracts reported in recent years are likely disproportionally understated due to a shorter period of time for additional purchase orders or contract amendments (usually increasing the value) compared with those contracts reported in earlier years.
52 Open tender contracts can occur under panels or via an open approach to market on AusTender, in accordance with the CPRs.
53 Department of Finance, Panel arrangements and multi-use lists, July 2014, <https://www.finance.gov.au/procurement/procurement-policy-and-guidance/…;.
54 On average, less than 5 per cent of prequalified tender and less than 1 per cent of limited tender are flagged as having a panel arrangement.
55 This analysis is based on the current contract values at the time the data was extracted, against the financial year that the contract commenced. As such, contracts reported in recent years are likely disproportionally understated due to a shorter period of time for additional purchase orders or contract amendments (usually increasing the value) compared with those contracts reported in earlier years.
56 Some of the entities listed in this figure undertook a relatively low number of procurements during the period. For further information on the number and value of contracts entered into for each entity, refer to Table 2.1.
57 As noted above, the Department of Finance manages Whole-of Government software maintenance and support and Internet Based Network Connections Services for other Departments. The Department of Finance’s use of panels is impacted by these arrangements.
58 Department of Finance, Panel Arrangements and Multi-use Lists (July 2014) <https://www.finance.gov.au/procurement/procurement-policy-and-guidance/buying/procurement-practice/panel-and-mul/principles.html>.
59 Of the 517 panels that were in operation between July 2011 and June 2016, 285 panels had at least five suppliers. The ‘top 20 per cent’ of suppliers had at least 5 contracts per year.
60 Each of the ‘top 20 per cent’ suppliers had won at least five contracts per year over the five year period.
61 Small businesses are included in the SME total.
63 ‘Other’ relates to all business not meeting the definition of an SME. I.e. 200 or more employees.
64 Department of Finance, 2015–16 Procurement Contracts: SME and Small Business Participation by Agency, available from <https://www.finance.gov.au/procurement/statistics-on-commonwealth-purchasing-contracts/> [accessed 15 February 2017].
65 Contracts may also include confidential outputs but not be flagged as confidential contracts. These have not been included in analysis of confidentiality.
66 Over 90 per cent of contracts list a single reason for confidentially, however contracts can list multiple reasons.
67 The Contract Notice Export is an export file containing contract notice data for all Australian Government agencies who report procurement on AusTender published over a one week period. Contract Notice Export files remain available on AusTender for a period of eighteen (18) months. Available at <https://www.tenders.gov.au/?event=public.reports.listCNWeeklyExport>
68 Contracts amended without changes to value or end date makes up less than 2 per cent of amended contracts. These amendments have not been included in this analysis (common changes include updates to Supplier ABN or contract description)
69 There are 12 contracts with changes to end date and no change to value.
70 The ‘AusTender CN’ data is a file containing Contract Notice data for all Australian Government agencies who report procurement on AusTender. Data is available at: <http://data.gov.au/dataset/historical-australian-government-contract-data>. ANAO analysed procurement data published to 11 September 2017.
71 The reporting thresholds (including GST) are: $10,000 for non-corporate Commonwealth entities; and for prescribed corporate Commonwealth entities, $400,000 for procurements other than construction services, or $7.5 million for construction services.